How we make this list: we compare pricing pages, product documentation and public user reviews. Rankite is independent; if a vendor ever pays for a featured spot, that listing is clearly labeled Partner.
Key takeaways
- Tableau leads on visualization quality at $75 per user per month (Creator, billed annually); Power BI is the cheapest major option at $14 per user per month (Pro).
- Metabase open source and Zoho Analytics' free plan are real $0 starting points for small teams, while Looker and Domo require sales quotes.
- The cost that matters most is per viewer, not per creator: once dashboards go company-wide, license math changes everything.
- Embedded analytics tools like Sisense and Looker are a different purchase than internal BI; buy them only if your customers will see the dashboards.
Quick comparison
| Tool | Best for | Starting price | Free plan |
|---|
 Tableau Tableau | Polished, flexible dashboards for all skill levels | $75 per user/month (Creator, billed annually) | Free trial (14 days) |
 Power BI Power BI | Microsoft-heavy teams that want the lowest price | $14 per user/month (Pro) | Yes (Power BI Desktop free) |
 Qlik Sense Qlik Sense | Associative exploration and guided analytics apps | $30 per user/month (billed annually) | Free trial (14 days) |
 Metabase Metabase | Technical teams that want open-source BI fast | $100 per month (Starter, 5 users included) | Yes (open source, self-hosted) |
 Zoho Analytics Zoho Analytics | Budget-conscious teams needing a full BI suite | $30 per month (Basic) | Yes |
 Looker Looker | Companies on Google Cloud with dedicated data teams | See website (custom, quote-based) | No |
 Sisense Sisense | Embedding analytics inside your own product | $399 per month (Launch) | Free trial |
 Domo Domo | All-in-one data apps with broad connector coverage | See website (consumption-based) | Free trial |
Is your product missing or out of date?
We review this list regularly. Vendors can request a listing, send updated pricing or ask about featured placement.
The top data visualization software
#1
Tableau
Best for: Polished, flexible dashboards for all skill levels
Visit tableau.com
Starting price$75 per user/month (Creator, billed annually)
Free planFree trial (14 days)
Tableau earned its reputation the hard way: by making charts anyone can read. The drag-and-drop canvas remains the most intuitive way to turn a messy dataset into a dashboard, and the company's long focus on visual design shows in every default. Analysts get depth with calculated fields and mapping; casual users get dashboards they can filter without training.
In 2026 Tableau has leaned hard into AI features, including conversational analytics and a knowledge engine meant to keep metrics consistent across dashboards. That is useful for mid-size companies where "revenue" means three different things in three departments. The ecosystem is another real advantage: free tutorials, a huge community forum, and the public gallery full of examples you can study.
The honest catch is the license structure. Creators cost $75 per user per month on annual billing, Explorers $42, and Viewers $15. A team with a few builders and fifty viewers is paying for fifty viewers, every month, forever. Tableau Desktop is now free, which helps individuals, but sharing work still runs through paid cloud or server licenses. Budget the viewer tier before you fall in love with the product.
What we like- Broadest library of chart types and visualization best practices
- Large user community and free learning resources
- Tableau Desktop is now free to download
Watch out for- Viewer and Explorer licenses still add up at scale
- Advanced calculations have a real learning curve
Starting price$14 per user/month (Pro)
Free planYes (Power BI Desktop free)
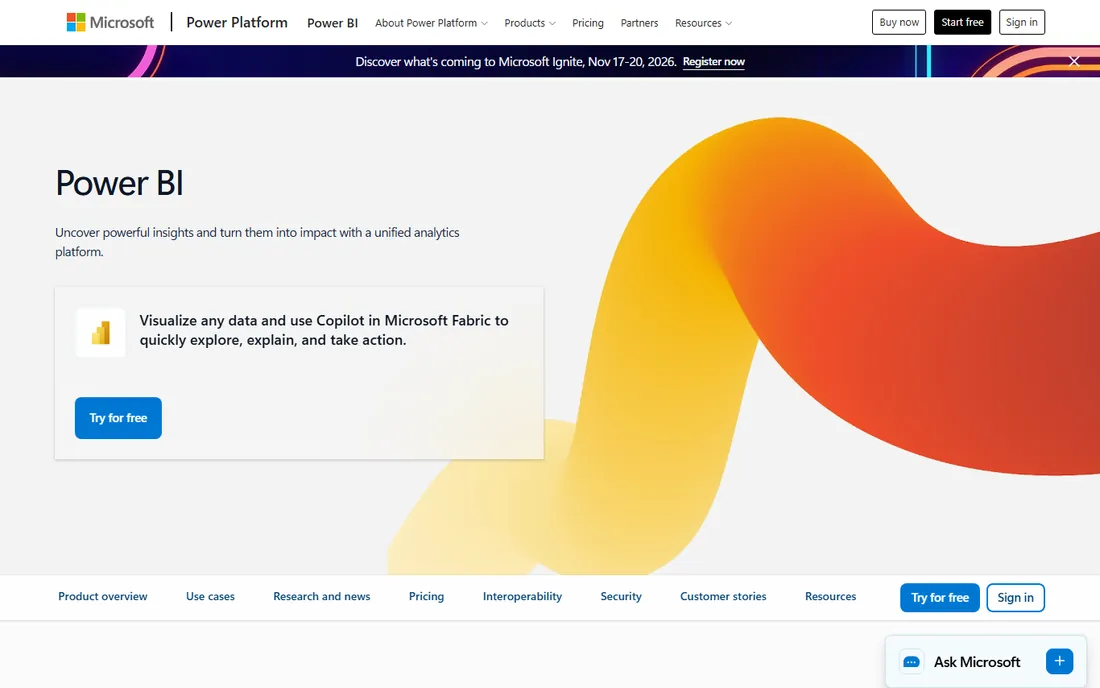
If your company already pays for Microsoft 365, Power BI is the obvious first look. Pro licenses at $14 per user per month are a fraction of what competitors charge, and dashboards live inside Teams, SharePoint, and Excel workflows your staff already knows. For a small business that lives in Microsoft's world, the adoption friction is close to zero.
What stands out is how much you get for the money. Power BI Desktop is free and surprisingly capable, the DAX formula language handles serious modeling, and the connection library covers most databases and cloud apps. Microsoft also keeps folding Power BI deeper into Fabric, its broader analytics platform, which matters if your data ambitions grow beyond dashboards.
The catch is licensing complexity. Free users can build reports but cannot share them broadly; real collaboration needs Pro licenses on both ends, or Premium capacity that starts far above small-business budgets. The interface also assumes some data literacy, and DAX is genuinely hard to learn. Power BI is the value king, but read the licensing rules carefully before rolling it out to a hundred people.
What we like- Lowest per-user price among major BI tools
- Deep integration with Microsoft 365 and Teams
- Power BI Desktop is free for building reports
Watch out for- Sharing and collaboration need paid licenses for everyone involved
- Premium capacity is a big cost jump for smaller firms
#3
Qlik Sense
Best for: Associative exploration and guided analytics apps
Visit qlik.com
Starting price$30 per user/month (billed annually)
Free planFree trial (14 days)
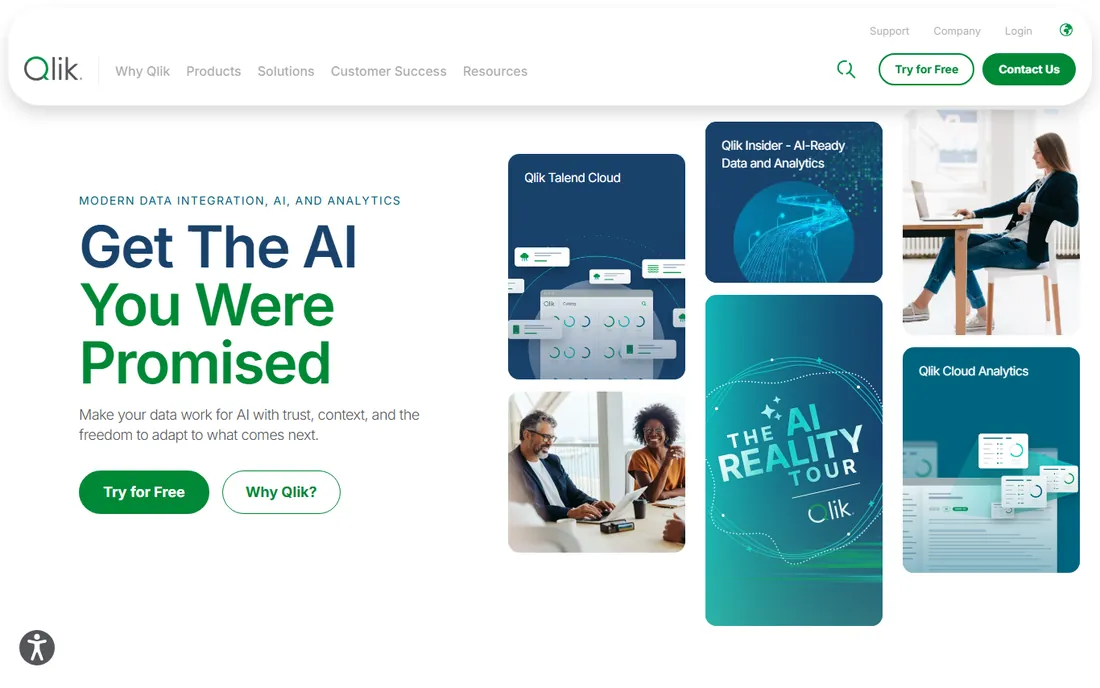
Qlik Sense takes a different approach to exploring data, and some analysts swear by it. Its associative engine does not just show the data that matches your filters; it shows what is excluded and how selections relate to each other. For someone investigating why sales dipped in one region, that "what am I not seeing" view can surface the answer faster than drilling through charts manually.
The platform is aimed squarely at business users who need guardrails. IT defines the data model once, and teams explore freely inside it without breaking the underlying numbers. Qlik has also pushed into AI-assisted analytics, and its embedded options let product teams put governed dashboards inside customer-facing apps. For mid-size companies that want self-service without chaos, that balance works well.
Where it falls short is polish. The interface is functional rather than beautiful, and building truly custom visuals takes more effort than in Tableau. The $30 per user per month Business tier is straightforward, but anything bigger moves to capacity-based pricing that requires a quote. If your team values exploration over presentation, Qlik Sense deserves a trial.
What we like- Associative engine surfaces relationships other tools miss
- Strong governed self-service for business users
- Solid embedded analytics options
Watch out for- Interface feels less polished than Tableau or Power BI
- Larger deployments need a sales conversation for exact pricing
Starting price$100 per month (Starter, 5 users included)
Free planYes (open source, self-hosted)
Metabase is the tool your engineers will install on a Friday afternoon and have running by Monday. A single Docker command starts a working analytics server against your database, and within an hour someone non-technical is building their first chart. That speed is why it has become the default BI pick for startups and developer-led teams.
The product philosophy is simple: let people ask questions in plain language or with a visual query builder, and reserve SQL for those who want it. Dashboards, subscriptions, and alerts all work as expected, and the cloud Starter plan at $100 per month for five users is reasonable when you outgrow self-hosting. The open-source version is the real deal, not a crippled demo, which is rare in this category.
The tradeoff is that you are the IT department for the free version. Backups, upgrades, and security patches are your job. Metabase also does less heavy data preparation than the enterprise suites; if your data needs serious cleaning and modeling before it can be charted, you will do that work elsewhere. For teams with technical chops and straightforward data, it is hard to beat.
What we like- Spins up in minutes with a single Docker command
- Open-source version is genuinely free
- Simple enough for non-technical teammates
Watch out for- Self-hosting means you own maintenance and upgrades
- Fewer advanced data-prep features than paid suites
#5
Zoho Analytics
Best for: Budget-conscious teams needing a full BI suite
Visit zoho.com
Starting price$30 per month (Basic)
Free planYes
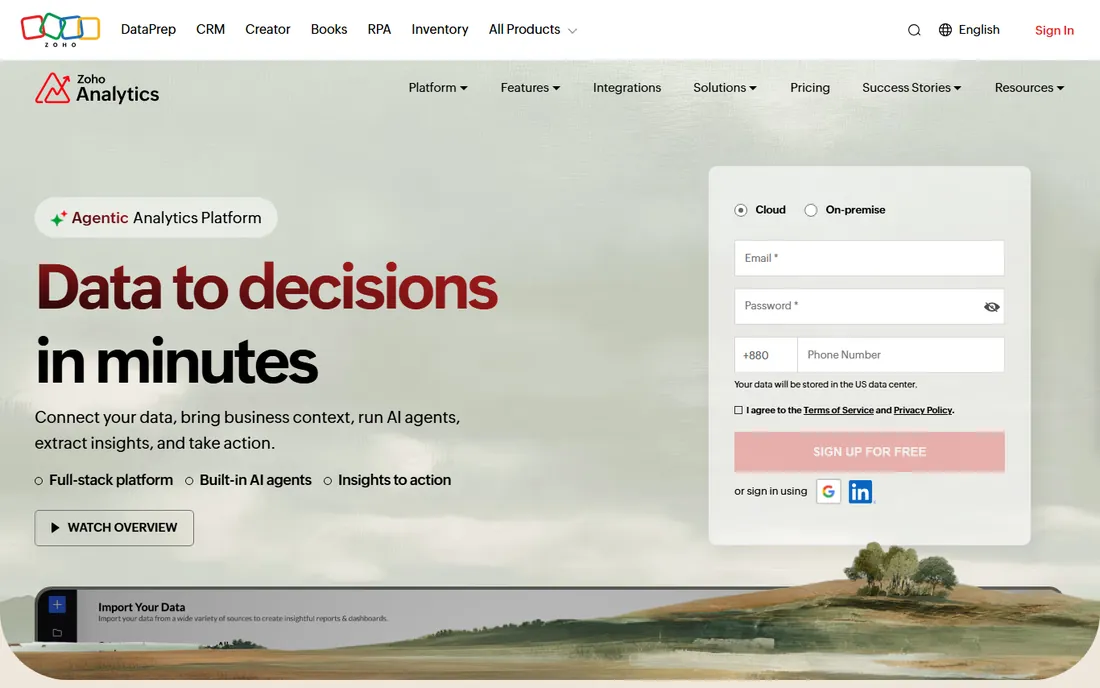
Zoho Analytics is the value pick on this list. Where competitors charge per user and watch costs climb with every new viewer, Zoho prices by workspace tiers starting at $30 per month for Basic, with a free plan that covers two users and real functionality. For a small business that needs dashboards without a BI line item in five figures, that pricing is a relief.
The product itself is more capable than the price suggests. More than 500 connectors pull in data from spreadsheets, databases, cloud apps, and other Zoho products. The drag-and-drop builder handles 50-plus chart types, and the Ask Zia assistant lets people type questions in plain English and get charts back. Scheduled emails, row-level security, and mobile apps round out a genuinely complete package.
The honest limits show up at scale. The third-party integration ecosystem is smaller than what surrounds Tableau or Power BI, so unusual data sources may need workarounds. Power users doing complex data modeling will find the enterprise tools more capable. But for a team that needs reliable dashboards on a tight budget, Zoho Analytics is the easiest recommendation in this roundup.
What we like- Over 500 data connectors included at every tier
- Ask Zia AI assistant builds charts from plain English
- Generous free plan for small teams
Watch out for- Smaller third-party ecosystem than Tableau or Power BI
- Advanced data modeling lags the enterprise players
Starting priceSee website (custom, quote-based)
Free planNo
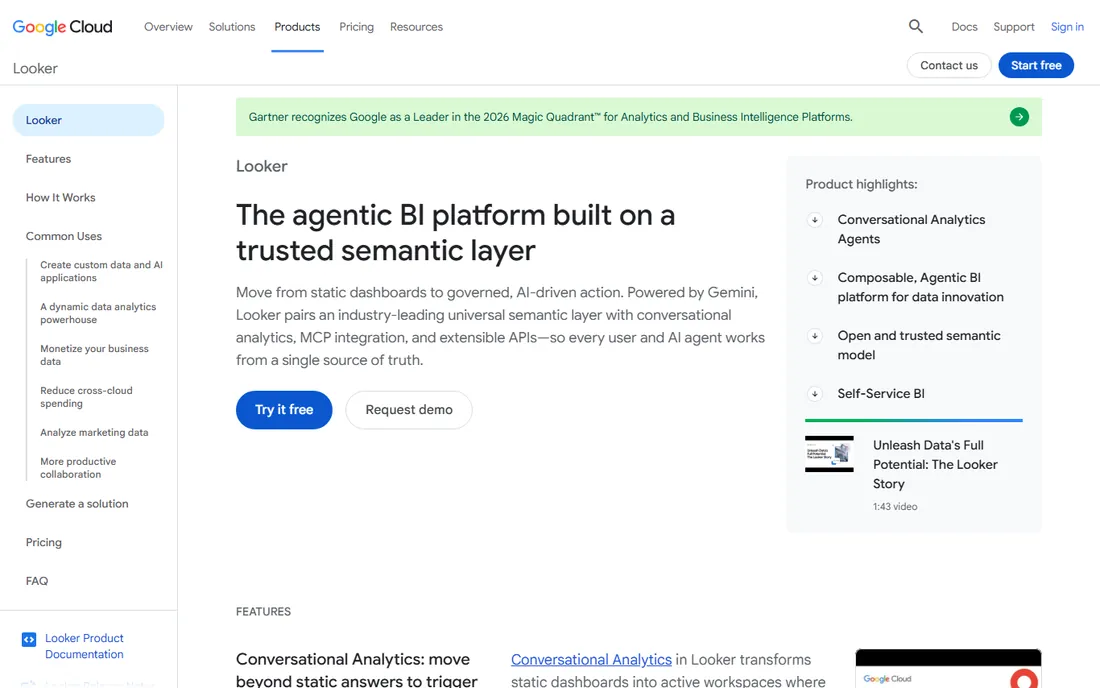
Looker is built for one specific setup: a company with real data engineering behind its BI. The core idea is LookML, a modeling language where your data team defines metrics like "active customer" exactly once. Every dashboard, report, and AI agent then uses that same definition, so the CEO and the marketing lead can never disagree on the numbers. For organizations burned by conflicting reports, that single source of truth is worth real money.
In 2026 Google has positioned Looker as an agentic BI platform, with conversational analytics and dashboard agents powered by Gemini that work off the same governed models. The integration with BigQuery is genuinely deep, and the embedded analytics options are strong for companies that need to put analytics inside their own products.
The barrier is the team requirement. Someone has to write and maintain LookML, which means Looker makes no sense without data analysts or engineers on staff. Pricing is quote-based with platform and per-user components, so small businesses cannot easily estimate costs. If you run on BigQuery and have the staff, Looker is excellent. Without both, look elsewhere.
What we like- LookML semantic layer keeps every metric defined once and consistent
- Strong governed self-service for business users
- Deep BigQuery and Google Cloud integration
Watch out for- Requires analysts who can write LookML
- Quote-based pricing makes budgeting uncertain up front
Starting price$399 per month (Launch)
Free planFree trial
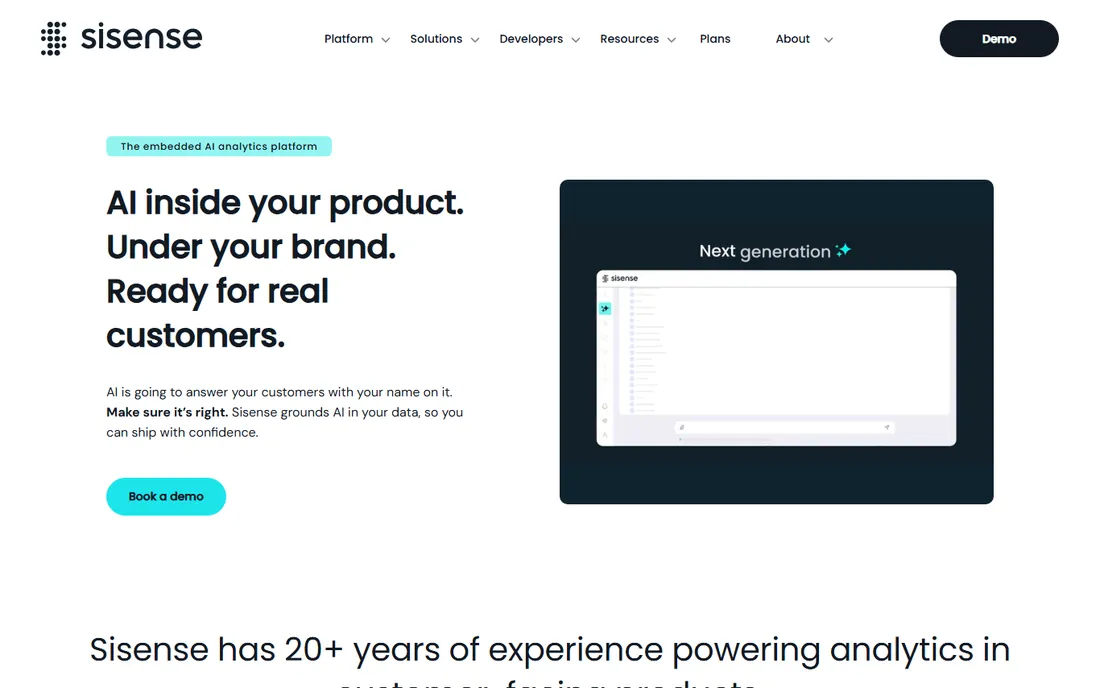
Where most tools on this list serve internal teams, Sisense serves your customers. It is the embedded analytics specialist: you build dashboards and analytical features into your own SaaS product, and your users get insights under your brand without ever knowing Sisense is involved. Multi-tenant architecture and row-level security keep each customer's data properly separated.
The developer story is the draw. Compose SDK and flexible APIs let product teams control exactly where intelligence appears and how it behaves, from lightweight widgets to fully custom builds. Sisense has spent two decades on this use case, and it shows in the maturity of the embedding options and the governance controls around AI-generated answers.
For internal BI, though, Sisense is the wrong tool. The Launch tier starts at $399 per month, which is real money for dashboards only your staff sees. If your product strategy includes customer-facing analytics, Sisense belongs on your shortlist. If you just need the leadership team to see sales numbers, one of the cheaper options above will do.
What we like- Purpose-built for embedded, multi-tenant analytics
- Strong APIs and SDKs for custom builds
- Governed AI features for customer-facing products
Watch out for- Overkill if you only need internal dashboards
- Entry price is steep for very small teams
#8
Domo
Best for: All-in-one data apps with broad connector coverage
Visit domo.com
Starting priceSee website (consumption-based)
Free planFree trial
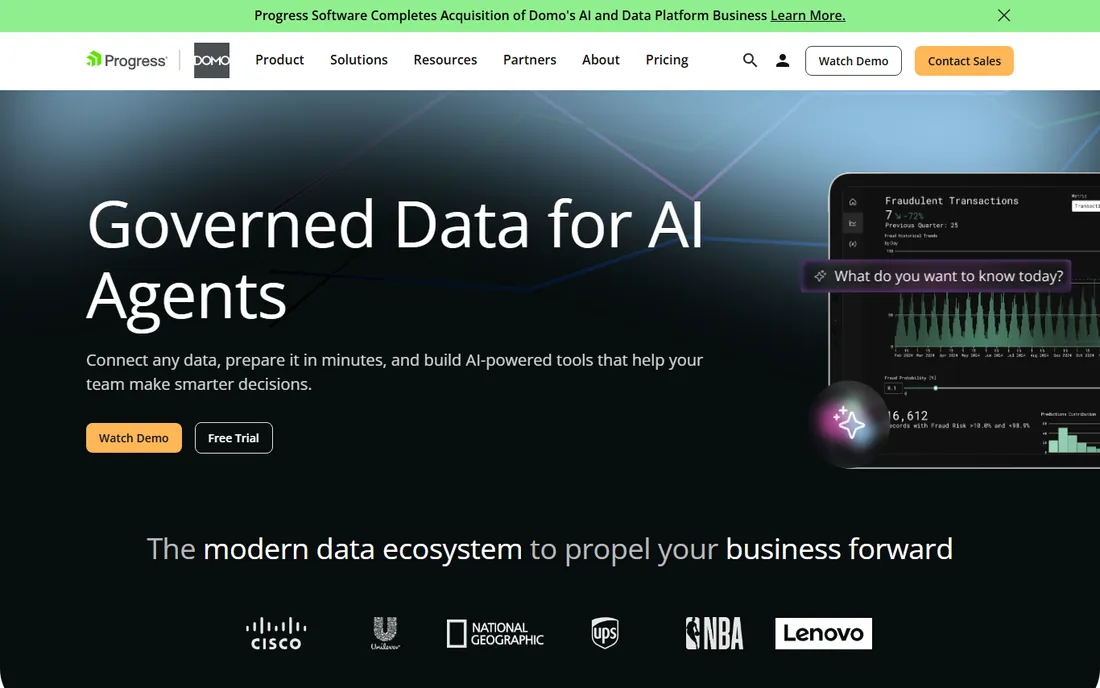
Domo wants to be your entire data platform, not just your chart builder. It combines data connectors, preparation, visualization, and app building in one cloud service, with a connector library that covers more sources than almost anyone else. If your data is scattered across dozens of systems, Domo's pitch is that you connect everything once and never think about pipelines again.
The platform has moved aggressively into AI, with task-specific agents for things like HR benefits questions, competitive research, and retail analytics. The dashboards themselves are solid, with good mobile support and real-time data capabilities that operations teams appreciate.
The catch is the pricing model. Domo charges on consumption-based credits rather than simple per-user tiers, which makes it genuinely hard to predict what you will pay until you are already running. For mid-size companies with messy data and real budgets, that flexibility can work. For smaller teams, the uncertainty alone is a reason to prefer a tool with a number on its pricing page.
What we like- Library of 1,000-plus connectors for nearly any data source
- Combines BI with data prep and custom data apps
- AI agents for specific business tasks
Watch out for- Consumption-based pricing is hard to predict
- Can be expensive for smaller companies
How we chose
We started from vendor pricing pages, product documentation, and the feature lists each company publishes for its current plans. We cross-checked prices against public review sites like G2 and Capterra and against discussions on Reddit from people who actually administer these tools. We favored tools with transparent pricing, a real free or trial tier where possible, and a clear fit for small and mid-size companies rather than enterprise-only platforms.
We did not test every product hands-on. Our comparisons come from published pricing, documented features, and what verified users report about day-to-day use. Prices change, so treat the figures here as a starting point and confirm on the vendor's site before you buy.
What to get right before you sign a contract
Match the tool to where your data lives
A company running on Microsoft 365 gets more from Power BI than from a technically superior tool nobody opens. A BigQuery shop with data engineers gets more from Looker. The best visualization tool is the one your team will actually use, and familiarity with your existing stack counts for more than feature checklists.
Price by viewers, not just creators
Almost every vendor prices builders and viewers differently. A $75 Creator license looks fine until you need fifty $15 Viewers to see the dashboards. Before choosing, count how many people will only ever look at reports, and price that exact mix across two or three finalists.
Try the free tier seriously
Metabase open source, Power BI Desktop, Tableau Desktop, and Zoho's free plan all let you connect real data at no cost. A two-week pilot with your actual spreadsheets teaches you more than any demo call. If a vendor will not let you touch the product before a sales conversation, treat that as information.
Internal BI and embedded analytics are different purchases
Dashboards for your staff and analytics inside your product have different requirements, different pricing, and different vendors that excel at each. Decide which one you are buying before you start comparing, or you will compare Sisense against Power BI and learn nothing useful.
What AI changes about data visualization in 2026
Every major vendor now ships AI features: conversational analytics that answer typed questions, agents that summarize dashboards, and assistants that suggest charts. In practice, these features are only as good as the data model underneath them. Tools with a governed semantic layer, like Looker's LookML or Tableau's knowledge engine, give AI a single definition of each metric to work from, which is why their AI answers tend to be more trustworthy.
For small and mid-size companies, the practical takeaway is modest. AI chart suggestions and plain-English questions can speed up routine analysis, but they do not replace clean data and someone who understands the business. Pick a tool whose core dashboards your team trusts first, and treat the AI features as a bonus rather than the reason to buy.
Frequently asked questions
Which data visualization software is best for beginners?
Zoho Analytics and Power BI are the friendliest starting points, with guided builders and plenty of free learning material. Metabase is also approachable if someone technical sets it up first. Tableau is easy for building basic charts but gets complex fast once you move into advanced calculations.
Is there really free data visualization software?
Yes. Metabase's open-source version is completely free to self-host, Power BI Desktop and Tableau Desktop are free for building reports, and Zoho Analytics has a free plan for two users. Google's Looker Studio is another free option for basic dashboards, though it is far simpler than the tools on this list.
How much should a small business spend on BI?
Most small teams can start at $0 to $100 per month with Metabase, Zoho Analytics, or a few Power BI Pro licenses. Budget $300 to $1,000 per month once dashboards reach the whole company. If a quote comes back in five figures, you are probably being sold an enterprise platform you do not need yet.
Tableau vs Power BI: which should I pick?
Pick Power BI if your company runs on Microsoft 365 and price matters; at $14 per user per month it is hard to argue with. Pick Tableau if visualization quality and flexibility matter more than cost, and you have analysts who will use its depth. Many companies end up fine with either.
Do I need a data team to use these tools?
Not for the basics. Zoho Analytics, Power BI, and Metabase all let non-technical users build dashboards from spreadsheets and common apps. You need data staff for Looker specifically, and for any setup involving complex data modeling, warehouses, or automated pipelines.
What is embedded analytics?
Embedded analytics means putting dashboards and charts inside your own product so your customers see them, rather than building reports for your internal team. Sisense and Looker specialize in this, with multi-tenant security and APIs for custom integration. It is priced and licensed differently from internal BI.
Sources we checked (9)
- https://www.tableau.com/
- https://www.tableau.com/pricing/teams-orgs
- https://powerbi.microsoft.com/
- https://cloud.google.com/looker
- https://qlik.com/
- https://www.sisense.com/
- https://domo.com/
- https://www.metabase.com/
- https://www.zoho.com/analytics
Is your product missing or out of date?
We review this list regularly. Vendors can request a listing, send updated pricing or ask about featured placement.

Shihab Mia · Founder, Rankite
Shihab has spent more than a decade helping SaaS and e-commerce brands grow through search. He writes Rankite's software buying guides from pricing pages, documentation and public user reviews. More about Shihab.