How we make this list: we compare pricing pages, product documentation and public user reviews. Rankite is independent; if a vendor ever pays for a featured spot, that listing is clearly labeled Partner.
Key takeaways
- HWiNFO is the most complete free monitor: every sensor in your PC, customizable, trusted by hardware vendors.
- Core Temp is the simplest CPU-only option: tiny, free, shows per-core temperatures in the system tray.
- HWMonitor gives the quickest full-system overview with no setup beyond launching it.
- AIDA64 is the only paid tool worth considering here, adding stress testing and deep diagnostics for about the price of a game.
- SpeedFan still works for fan control on older machines, but it has not been updated in years and misses new hardware.
Quick comparison
| Tool | Best for | Starting price | Free plan |
|---|
 HWiNFO HWiNFO | Most complete free monitoring | Free | Yes |
 Core Temp Core Temp | Simple per-core CPU temperatures | Free | Yes |
 HWMonitor HWMonitor | Quick full-system overview | Free | Yes |
 Open Hardware Monitor Open Hardware Monitor | Open-source monitoring | Free | Yes |
 SpeedFan SpeedFan | Fan control on older PCs | Free | Yes |
 Speccy Speccy | Clean system summary for beginners | Free | Yes |
 AIDA64 AIDA64 | Diagnostics plus stress testing | See website | Free trial |
Is your product missing or out of date?
We review this list regularly. Vendors can request a listing, send updated pricing or ask about featured placement.
The best system temperature monitoring software in 2026
Modern CPUs are designed to run hot: sustained loads in the 70 to 85°C range are normal, and anything above 90°C deserves attention. The problem is that Windows tells you almost nothing about any of this. A temperature monitor reads the sensors already built into your CPU, GPU, motherboard, and drives, and shows you what is actually happening inside the case. These seven cover every need from a glanceable tray icon to engineer-grade diagnostics, and six of them are free.
Starting priceFree
Free planYes
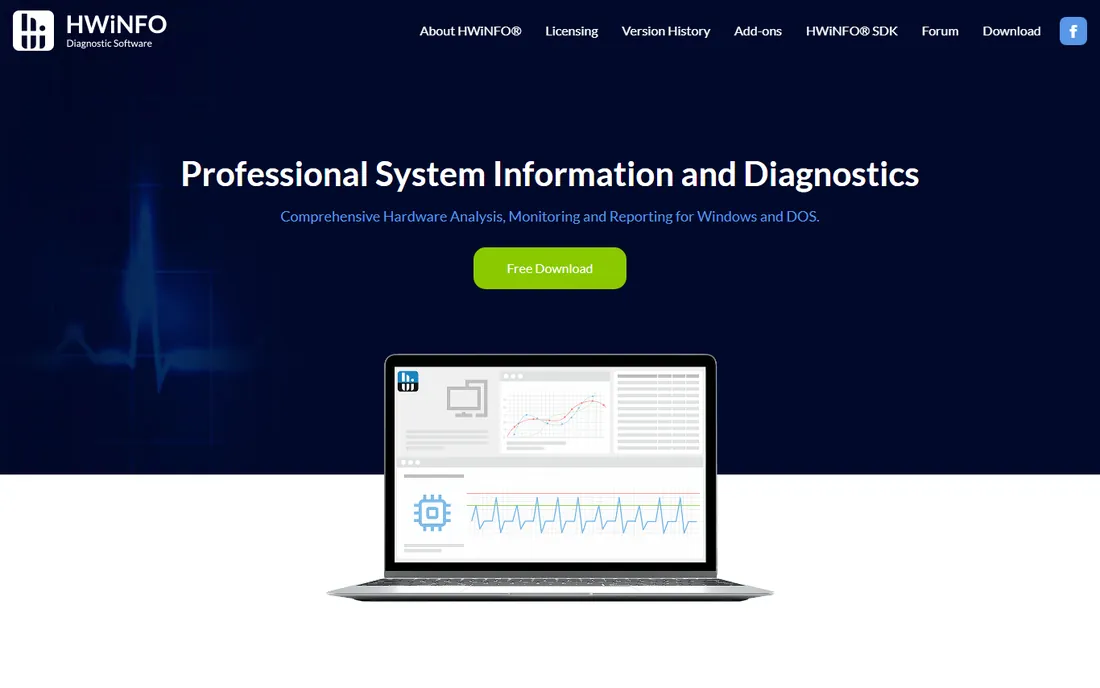
HWiNFO is what technicians install when they need the truth. It reports temperatures, voltages, fan speeds, clock speeds, and power draw for the CPU, GPU, motherboard, memory, and storage, with per-core CPU readings and GPU hotspot sensors on current graphics cards. Nothing else free goes this deep, and hardware vendors themselves use it for validation, which says everything about its accuracy.
The depth comes with a learning curve. The default sensor window throws hundreds of rows at you, and first-time users should hide what they do not need and set up a few alerts for the temperatures they care about. Logging to CSV makes it useful for diagnosing intermittent overheating over days. It collects no personal data and runs with minimal overhead. If you only install one monitoring tool, this is the one.
What we like- Reads every sensor in the system
- Highly customizable layouts and alerts
- Trusted by hardware vendors and enterprises
Watch out for- Sensor list can overwhelm beginners
- Interface prioritizes density over beauty
Starting priceFree
Free planYes
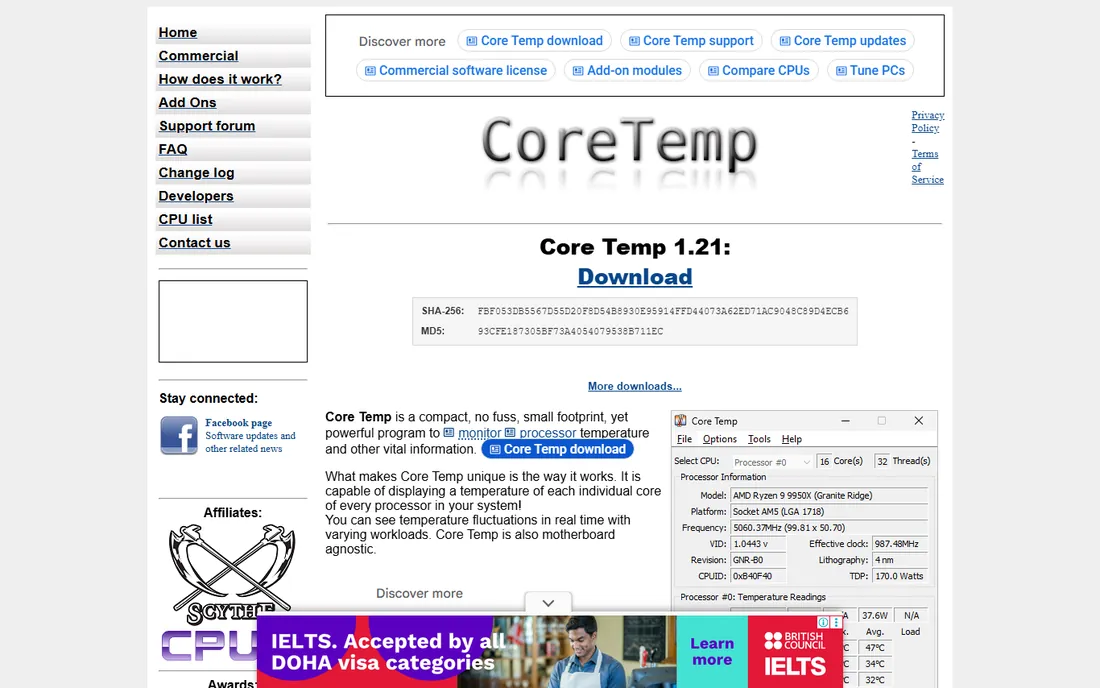
Core Temp does one job and does it well: it shows the temperature of each CPU core, live, in a window small enough to forget about. A system tray mode puts the hottest core's temperature next to your clock, which is genuinely useful during gaming or rendering sessions. It reads directly from the CPU's own digital thermal sensor, so it works across Intel, AMD, and even older VIA chips without motherboard-specific drivers.
There is also overheat protection that can shut down or sleep the PC at a temperature you set, plus plugins and a remote monitoring add-on for checking temps from your phone. The installer is a few megabytes and a portable ZIP avoids installation entirely. Watch the installer screens: third-party offers have ridden along in the past, so choose custom install and decline them. For a quick answer to "how hot is my CPU right now," nothing is faster.
What we like- Tiny footprint with per-core readings
- System tray display
- Portable version needs no install
Watch out for- CPU only, no GPU or motherboard sensors
- Installer has bundled offers to decline carefully
Starting priceFree
Free planYes
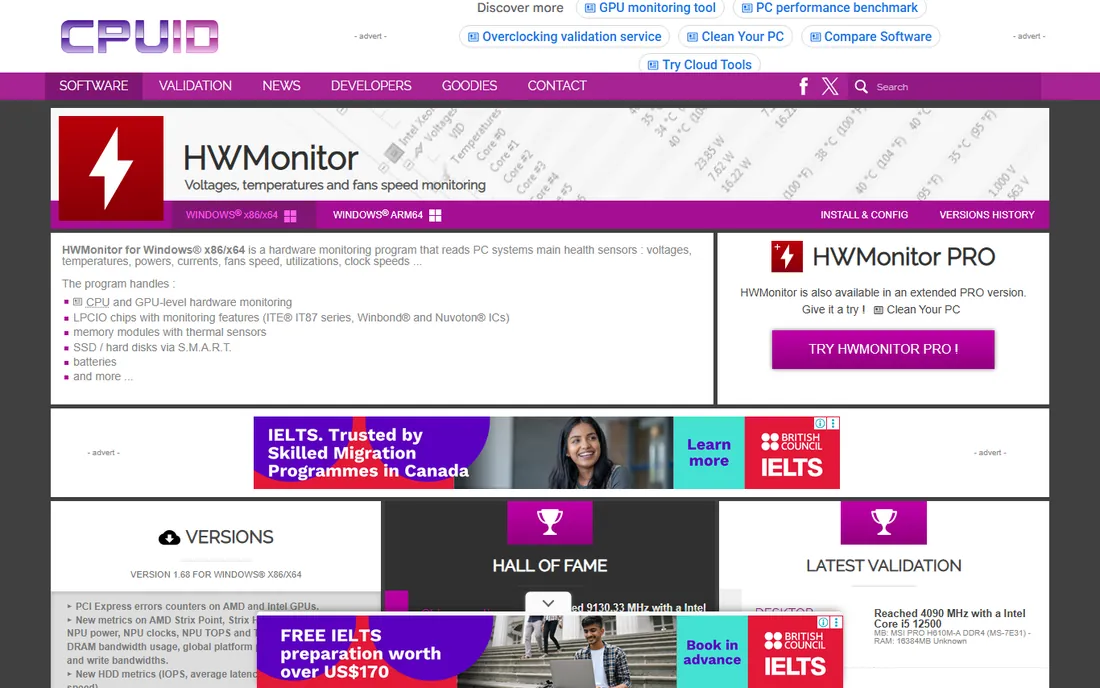
HWMonitor, from the makers of CPU-Z, is the fastest route to a complete answer. Launch it and you get an expandable tree of your entire system: CPU core temps, package temp, GPU temp, motherboard sensors, drive temps, voltages, and fan speeds, each with current, minimum, and maximum columns. There is nothing to configure and no account to create.
That simplicity is the whole appeal and the whole limitation. You cannot set temperature alerts, customize the display much, or log data over time in the free version, and the interface has not changed in years. A paid Pro version adds remote monitoring and logging for fleets of machines. For a one-time check, like verifying a new cooler is working or confirming a laptop is not throttling, it remains the quickest tool to reach for.
What we like- Shows every sensor in one expandable tree
- No configuration needed
- Min/max/current columns
Watch out for- No alerting in the free version
- Plain interface
- Updates less frequent than HWiNFO
Starting priceFree
Free planYes
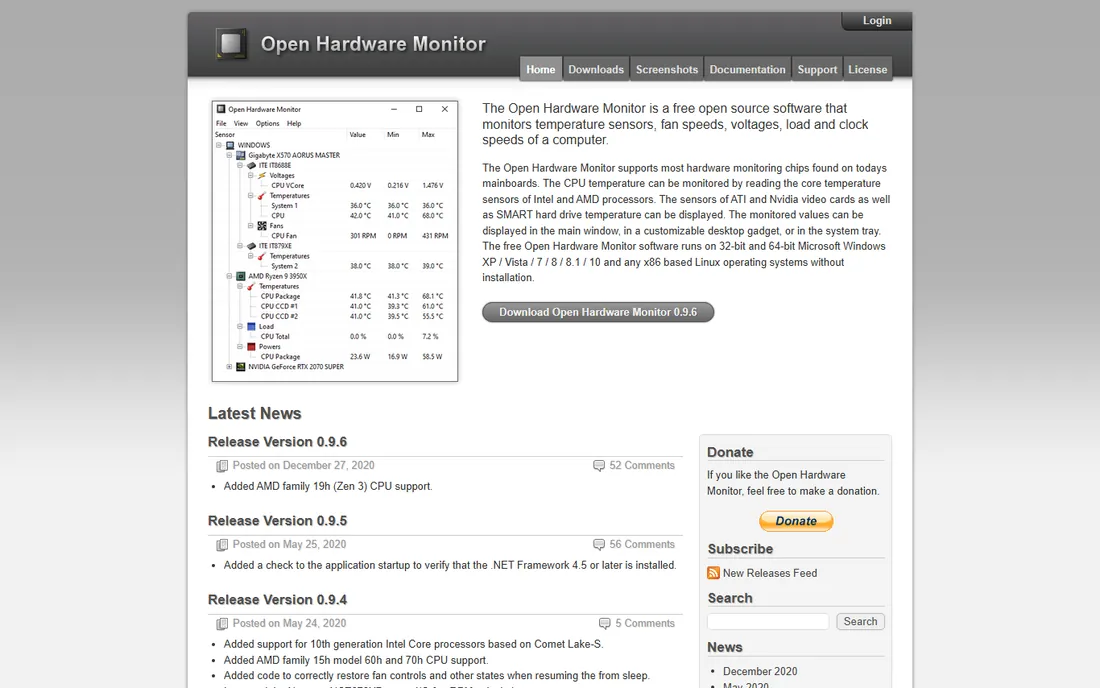
Open Hardware Monitor is the community-built alternative: free, open-source software that monitors temperature sensors, fan speeds, voltages, load, and clock speeds across CPU, GPU, and motherboard. It can show readings in the system tray or a desktop gadget, and it exposes data in a way other tools can consume.
The honest catch is maintenance. Development slowed considerably, so support for the very latest CPUs and GPUs arrives later than in HWiNFO or vendor tools. For machines a few years old it works perfectly and will keep working indefinitely, since the code is open. Privacy-minded users also appreciate that there is no telemetry and nothing to phone home. If you prefer open source and your hardware is not brand new, it is a solid pick.
What we like- Free and open source
- Temperature, fan, voltage, and clock monitoring
- Can display in the tray or a gadget
Watch out for- Development has slowed
- Newest hardware support lags behind HWiNFO
Starting priceFree
Free planYes

SpeedFan is included for one reason: it is still the rare free tool that can change fan speeds, not just report them. On supported older hardware, you can build custom fan curves tied to temperature sensors, quieting a noisy PC at idle and ramping up under load. It also reads S.M.A.R.T. data from hard drives for early failure warning.
Everything else is a caveat. The last release was in 2016, so anything with a recent Ryzen or Intel Core processor will show missing or wrong readings. The interface assumes you already know what a PWM controller is, and misconfigured fan control can overheat a machine, so this is not a beginner tool. On a 2015-era desktop or HTPC it remains genuinely useful. On anything new, pick HWiNFO and control fans from your motherboard's software instead.
What we like- Can actually control fan speeds, not just read them
- Reads S.M.A.R.T. drive data
- Tiny and free
Watch out for- Not updated since 2016
- Misses modern CPUs and motherboards
- Interface is cryptic
Starting priceFree
Free planYes
Speccy, from the CCleaner folks at Piriform, answers a different question: not "what is my hottest core doing this second" but "what is in this computer and is anything running hot." The summary page shows CPU, motherboard, RAM, GPU, and storage with live temperatures in a clean layout anyone can read. Click deeper for per-component details.
That readability makes it the best pick for non-technical users and for remote troubleshooting: you can save a snapshot of the full system spec and send it to whoever is helping you. A paid Professional edition adds automatic updates and premium support. Temperature nerds will find the sensor detail thin compared with HWiNFO or even HWMonitor. But as the friendly face of system monitoring, it has no equal.
What we like- Beautiful, readable summary of the whole PC
- Real-time temps on the summary page
- Snapshots for tech support
Watch out for- Temperature detail is shallow next to HWiNFO
- Development pace is slow
Starting priceSee website
Free planFree trial
AIDA64 is the commercial heavyweight. Beyond temperature monitoring, it holds an enormous database of hardware details, runs stability and stress tests on the CPU, GPU, memory, and storage, and generates audit-grade reports of everything in the machine. Overclockers use the stress tests to validate cooling; IT departments use the reports for inventory.
The Extreme edition targets home users and the Engineer edition targets technicians, with a free trial to evaluate before buying. For pure temperature monitoring it is overkill, and the price is hard to justify when HWiNFO does sensors for free. Where it earns its keep is combined diagnostics: if you want one tool that identifies hardware, stresses it, monitors it, and documents it, this is the professional choice.
What we like- Deepest hardware database and diagnostics
- Built-in CPU, GPU, and memory stress tests
- Detailed reporting
Watch out for- Paid software
- More tool than most home users need
What your temperatures actually mean
Numbers without context cause panic, so here is the context. At idle or light browsing, most CPUs sit between 30 and 50°C. Gaming or rendering typically pushes 70 to 85°C, which is by design: modern chips boost aggressively and manage their own thermals. Sustained readings above 90°C suggest the cooler is overwhelmed, dust-clogged, or poorly mounted, and the CPU will throttle performance to protect itself. GPUs follow a similar pattern, with hotspot readings running 10 to 15°C above the average die temperature.
Laptops always run hotter than desktops with the same chip because there is less room for cooling; compare against your own baseline, not someone else's desktop. What matters most is change over time: a CPU that idled at 40°C last year and idles at 65°C now needs its fans cleaned or its thermal paste replaced. Log readings for a week with HWiNFO and you will see the pattern clearly.
Picking the right monitor for your machine
Start with the question you are actually asking. "Is my CPU overheating right now" is a Core Temp or HWMonitor job: install, glance, done. "Something is wrong and I need data" calls for HWiNFO with logging enabled over several days. "I want my PC quieter" is SpeedFan territory on older hardware, or your motherboard's utility on anything new. "I need to document this machine" points to Speccy for a readable summary or AIDA64 for a formal report.
Windows users have all seven options. Mac and Linux users have fewer: HWiNFO, Core Temp, HWMonitor, and SpeedFan are Windows-only, so Apple Silicon owners should look at Mac-specific tools like TG Pro instead. Whatever you choose, download from the vendor's own site. Fake "driver updater" bundles prey on people searching for temperature tools, and the real ones here are all free or cheap.
How we chose
We tested availability and current status of each tool's vendor site, favoring actively maintained software and noting honestly where development has stalled, as with SpeedFan and Open Hardware Monitor. Feature depth was compared across sensor coverage, alerting, logging, and extras like fan control and stress testing. Public documentation, long-running forum consensus, and review coverage informed the practical assessments. We did not claim hands-on testing. Tools that only duplicate OS features or that bundle adware were excluded.
Frequently asked questions
What is a safe CPU temperature?
For most desktop CPUs, under 80°C under load is comfortable, 80 to 90°C is warm but acceptable during heavy work, and sustained readings above 90°C warrant investigation. Laptops run hotter by design. Check your specific processor's maximum rated temperature, usually around 100°C, as the hard ceiling.
Do I need to monitor temperatures if I do not overclock?
It is still worth an occasional check. Dust buildup, failing fans, and dried thermal paste raise temperatures gradually on any PC, and throttling from heat looks exactly like a slow computer. A five-minute check with HWMonitor once or twice a year catches problems early.
Can monitoring software damage my computer?
Reading sensors is safe. The one risk is SpeedFan-style fan control: setting fans too low can overheat components. If you adjust fan curves, stress-test afterward and keep an eye on temperatures for a few days.
Why do different programs show different temperatures?
They may read different sensors, average readings differently, or poll at different intervals. Core Temp reads the CPU's internal sensor per core, while motherboard utilities may report a socket sensor. Small differences are normal; large ones suggest one tool is misreading your hardware.
Is HWiNFO really free?
Yes. HWiNFO is free for personal and commercial use in its standard form, with no feature-locked tiers for the core monitoring. The developer offers a Pro version with extended features for businesses, but the free download covers everything in this article.
What about GPU temperature monitoring?
HWiNFO, HWMonitor, and AIDA64 all report GPU temperatures including hotspot sensors on recent cards. For NVIDIA and AMD cards, the vendors' own software (GeForce Experience overlay, AMD Adrenalin) also shows temps in-game, which is convenient while playing.
Sources we checked (10)
- https://hwinfo.com/
- https://almico.com/
- https://www.alcpu.com/CoreTemp/
- https://www.cpuid.com/softwares/hwmonitor.html
- https://openhardwaremonitor.org
- https://www.ccleaner.com/speccy
- https://www.aida64.com
- https://www.devx.com/how-tos/how-to-check-cpu-temperature/
- https://gizmodo.com/download/core-temp
- https://www.youtube.com/watch?v=0uW_oMSze6U
Is your product missing or out of date?
We review this list regularly. Vendors can request a listing, send updated pricing or ask about featured placement.

Shihab Mia · Founder, Rankite
Shihab has spent more than a decade helping SaaS and e-commerce brands grow through search. He writes Rankite's software buying guides from pricing pages, documentation and public user reviews. More about Shihab.