How we make this list: we compare pricing pages, product documentation and public user reviews. Rankite is independent; if a vendor ever pays for a featured spot, that listing is clearly labeled Partner.
Key takeaways
- MSI Afterburner remains the default pick for gamers who want an in-game overlay plus fan and clock control, and it costs nothing.
- HWiNFO gives the deepest sensor data of any tool here, including per-chip VRAM temperatures on recent AMD cards, free for personal use.
- GPU-Z is the fastest way to verify exactly which graphics card you own, with sensor graphs and a one-click validation link for secondhand buyers.
- If you only want a clean dashboard with no learning curve, NZXT CAM or HWMonitor cover the basics without asking for money.
- Mac owners have one serious option for menu-bar GPU stats: iStat Menus, which now tracks GPU frame rates on Apple Silicon.
Quick comparison
| Tool | Best for | Starting price | Free plan |
|---|
 MSI Afterburner MSI Afterburner | Gamers and overclockers who want one free tool for tuning and monitoring | Free | Yes |
 HWiNFO HWiNFO | Enthusiasts and technicians who want every sensor reading a PC can produce | Free | Yes |
 GPU-Z GPU-Z | Verifying a graphics card's identity and watching its sensors in a lightweight window | Free | Yes |
 HWMonitor HWMonitor | Anyone who wants a plain tree view of every temperature, voltage and fan speed | Free | Yes |
 AIDA64 Extreme AIDA64 Extreme | Enthusiasts who want monitoring plus benchmarking and stress testing in one suite | See website | Free trial |
 NZXT CAM NZXT CAM | PC owners who want a modern, good-looking monitoring dashboard for free | Free | Yes |
 AMD Software: Adrenalin Edition AMD Software: Adrenalin Edition | Radeon GPU owners who want monitoring built into their driver | Free | Yes |
 CapFrameX CapFrameX | Gamers and reviewers who benchmark frame rates and frame times precisely | Free | Yes |
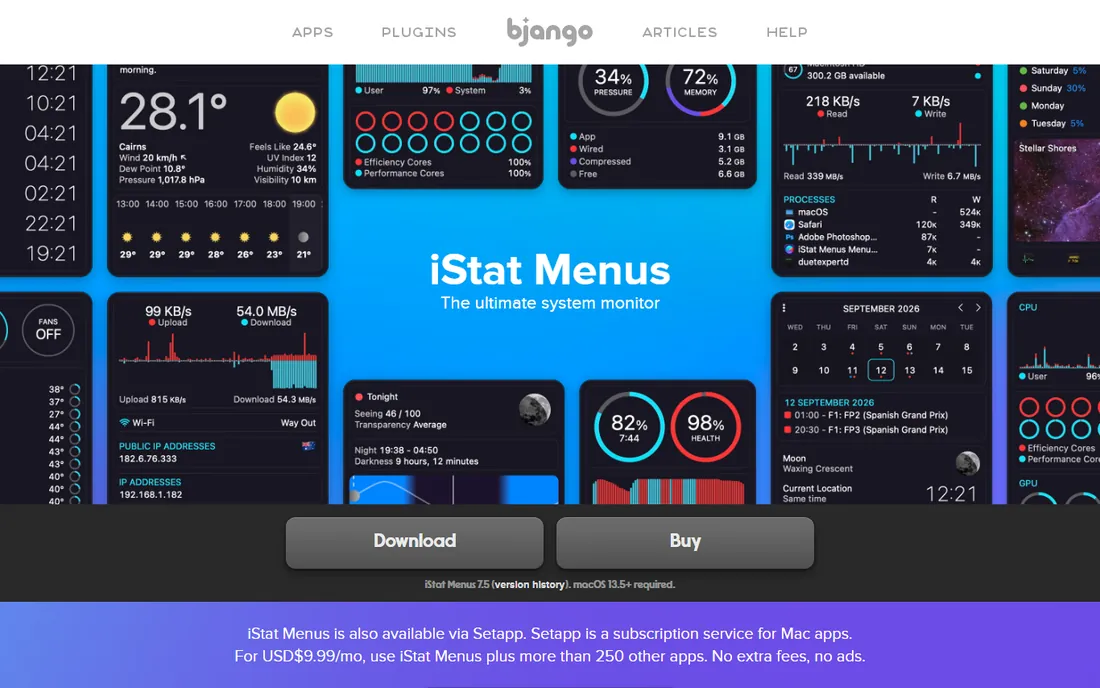
 iStat Menus iStat Menus | Mac users who want live GPU and system stats in the menu bar | See website | Free trial |
Is your product missing or out of date?
We review this list regularly. Vendors can request a listing, send updated pricing or ask about featured placement.
The best GPU monitoring software
#1
MSI Afterburner
Best for: Gamers and overclockers who want one free tool for tuning and monitoring
Visit msi.com
Starting priceFree
Free planYes
When a PC gamer asks how to watch GPU temperatures while playing, this is the name that comes up first, and the reason is simple. MSI Afterburner combines hardware monitoring with actual control: core and memory clocks, power and temperature limits, voltage on supported cards, and fan speed curves you draw yourself. The monitoring side feeds a customizable on-screen display through the bundled RivaTuner Statistics Server, so frame rate, temperature, usage and clock speed sit in the corner of the screen while you play. MSI states on its own page that the software is completely free and works with graphics cards from all brands.
The catch is mostly cosmetic and platform-related. The interface has barely changed in a decade, and the deep settings assume you know what a voltage curve editor is. It also runs on Windows only, so Mac and Linux users need to look elsewhere on this list. Download it only from msi.com or Guru3D. MSI warns that fake Afterburner sites distribute malware, so download carefully.
What we like- Works with graphics cards from any brand, not just MSI
- In-game on-screen display through RivaTuner Statistics Server
- Custom fan curves and voltage control
Watch out for- Windows only
- The interface looks dated and the settings menu takes some learning
#2
HWiNFO
Best for: Enthusiasts and technicians who want every sensor reading a PC can produce
Visit hwinfo.com
Starting priceFree
Free planYes
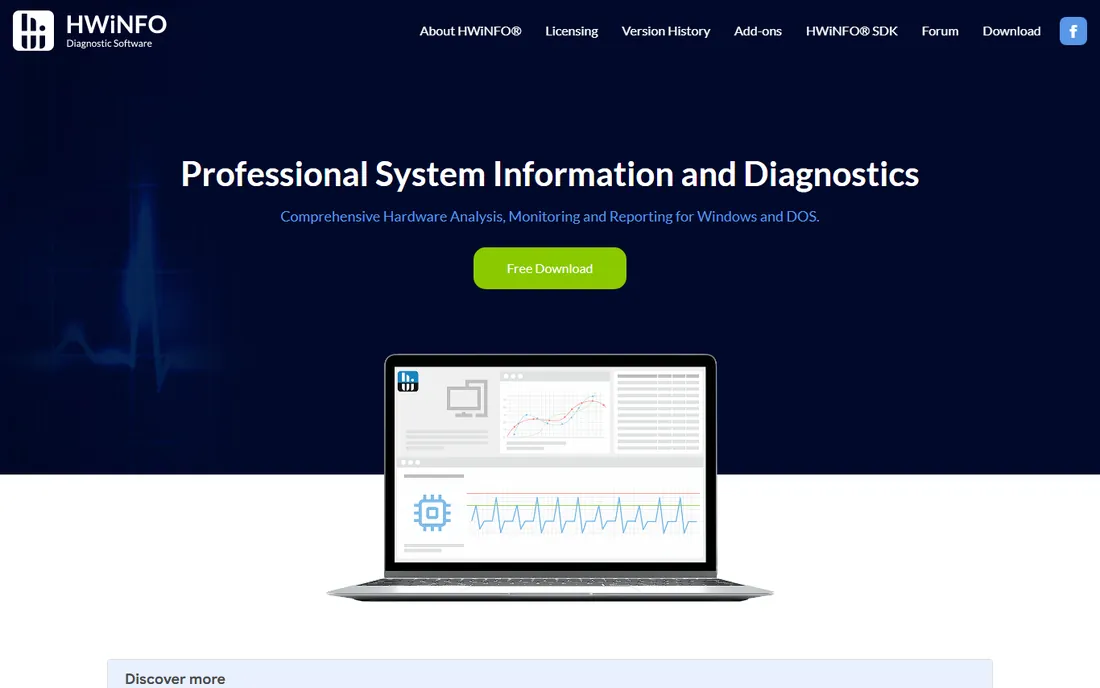
Nobody reports more numbers than HWiNFO. Where most monitors show a GPU temperature, HWiNFO shows the GPU temperature, the hotspot, memory junction temperature, and on recent AMD cards even per-chip VRAM temperatures that reveal a single memory package running hotter than its neighbors. That level of detail is why repair techs and overclockers keep it open during stress tests. It launches fast, uses very little overhead, and a portable build runs from a USB stick without touching the system you are diagnosing.
The free version covers personal use completely, which is all most buyers need. A paid Pro license exists for commercial deployments and adds command-line logging and remote monitoring of up to 50 machines. The honest downside is the firehose of data: the sensor window lists hundreds of readings, and new users often do not know which ones matter. If you want a tidy dashboard, NZXT CAM or HWMonitor will feel calmer. If you want the truth about your hardware, this is it.
What we like- The most complete sensor coverage of any tool on this list
- Portable version runs without installing
- Customizable alerts and logging
Watch out for- The sensor list can overwhelm beginners
- Commercial use requires a paid Pro license
#3
GPU-Z
Best for: Verifying a graphics card's identity and watching its sensors in a lightweight window
Visit techpowerup.com
Starting priceFree
Free planYes
Buying a used graphics card without GPU-Z is asking for trouble. The tool reads the card directly and reports the exact GPU, memory type and size, BIOS version, driver, bus interface and supported features, then lets you upload a validation to TechPowerUp that proves the card is what the seller claims. Its Sensors tab graphs clock speeds, temperatures, fan speeds, power draw and memory usage in real time, and it can log those readings to a file for later review.
GPU-Z does one job and does it well, which is also its limit. It will not show CPU temperatures, motherboard voltages or drive health, and it cannot change fan speeds or clock anything. Think of it as an ID card for your graphics card rather than a full system tool. For quick checks and secondhand purchases it is unmatched, and it costs nothing.
What we like- Tiny standalone download with no installation
- Detailed card identification including BIOS version
- One-click online validation
Watch out for- GPU-only, with no CPU or system sensors
- No fan control or alerting
#4
HWMonitor
Best for: Anyone who wants a plain tree view of every temperature, voltage and fan speed
Visit cpuid.com
Starting priceFree
Free planYes
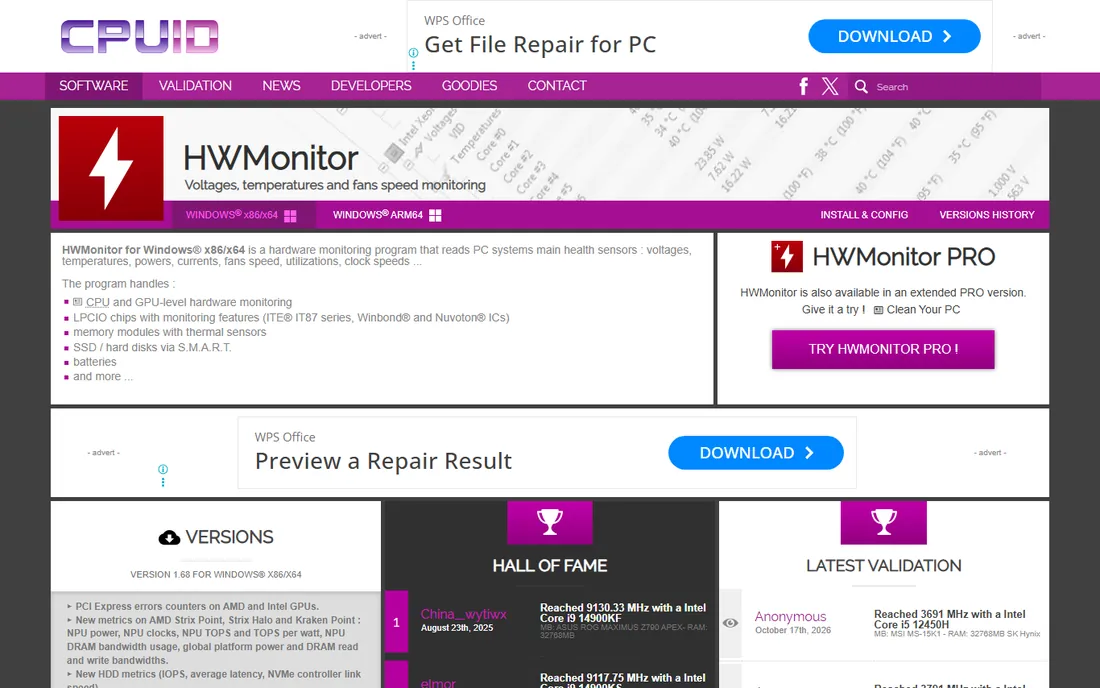
HWMonitor is the tool you open when you want an answer in ten seconds. It lists every sensor in your system as an expanding tree: CPU package and per-core temperatures, GPU temperatures and clocks, voltages, fan speeds, drive temperatures via S.M.A.R.T. and laptop battery data. Each reading shows its current, minimum and maximum value, which makes it easy to spot a spike that happened while you were away. CPUID keeps it current, with version 1.68 arriving in September 2026 with support for the newest AMD and Intel hardware.
What you do not get is any control or proactivity. HWMonitor cannot change a fan curve, cannot pop up an alert when a temperature crosses a line, and cannot draw an overlay in games. A paid PRO edition adds data logging, graphs and remote monitoring for people managing test rigs or servers. One caution from 2026 worth knowing: CPUID's download pages were briefly compromised in April 2026 to serve malicious installers, an incident the company confirmed and contained within a day. Verify checksums when you download, as CPUID itself recommends.
What we like- Extremely light and fast to start
- Clear tree layout with current, minimum and maximum values
- Covers CPU, GPU, drives and batteries
Watch out for- No fan control, no alerts, no in-game overlay
- The interface has no dark mode or theming
#5
AIDA64 Extreme
Best for: Enthusiasts who want monitoring plus benchmarking and stress testing in one suite
Visit aida64.com
Starting priceSee website
Free planFree trial
AIDA64 Extreme sits a level above simple monitors because it also tests. Its System Stability Test pushes the CPU, GPU, memory and storage at the same time while graphing temperatures, voltages and fan speeds, which is exactly how you find out whether an overclock survives real load. The reporting tools export full system audits to HTML or CSV, handy when documenting a build for a client or a warranty claim.
The standout feature for GPU watchers is SensorPanel: a fully customizable dashboard you can park on a second monitor or tablet, showing live GPU temperature, load and fan speed at a glance. The price of admission is real money, since AIDA64 has no free tier, only a 30-day trial of the full product. If you only need temperatures, the free tools above do that. If you benchmark and validate systems regularly, the trial usually sells itself.
What we like- System Stability Test stresses CPU, GPU, memory and drives together
- Customizable SensorPanel for a second screen
- Supports over 50 external LCD displays
Watch out for- No free version beyond the trial
- The interface packs in so much that beginners get lost
#6
NZXT CAM
Best for: PC owners who want a modern, good-looking monitoring dashboard for free
Visit nzxt.com
Starting priceFree
Free planYes
NZXT CAM is the monitor you recommend to someone who finds HWiNFO intimidating. It shows real-time CPU, GPU, memory and storage readouts with temperature graphs, and a mini mode docks a compact overlay on the desktop. The in-game overlay displays FPS alongside CPU and GPU temperatures, and NZXT publishes that the software is free for any Windows PC with no account, no sign-in and no upsell. If you own NZXT cooling or lighting hardware, the same app controls fan curves, RGB and Kraken LCD screens, which makes it a genuine control center rather than just a viewer.
The limits are clear and NZXT states them plainly. Without NZXT hardware, CAM monitors but cannot change fan speeds, and it does not control RGB on RAM or graphics cards. There is also no macOS or Linux version. CAM sends anonymized usage and performance data by default, though this can be disabled in settings. For a free, attractive, low-effort GPU monitor on a Windows gaming PC, it is hard to beat.
What we like- Clean and readable interface with mini mode overlay
- In-game FPS and temperature overlay
- No account, no sign-in, no upsell
Watch out for- Fan control and RGB only work with NZXT hardware
- Windows only
#7
AMD Software: Adrenalin Edition
Best for: Radeon GPU owners who want monitoring built into their driver
Visit amd.com
Starting priceFree
Free planYes
If your PC runs a Radeon card, you already own a capable GPU monitor. AMD Software: Adrenalin Edition includes a Performance Metrics panel that tracks frame rate, frame time, GPU utilization, clock speeds, temperatures including junction temperature, fan speed, memory utilization and power draw, plus CPU and system memory figures. The metrics can appear as an in-game overlay, and the logging feature writes the numbers to a file with an adjustable sampling interval, which is useful for diagnosing stutter after the fact.
The obvious limitation is that it only exists for AMD hardware. It is also a driver suite first and a monitor second, so the interface is organized around graphics settings rather than sensor watching. Still, for Radeon owners it removes any reason to install a separate monitor for everyday use, and it costs nothing beyond the driver download.
What we like- No extra software to install
- Detailed metrics overlay with FPS, frame time, temperatures and power
- Built-in performance logging to file
Watch out for- Only useful with AMD graphics cards
- The overlay must be re-enabled each gaming session in some versions
#8
CapFrameX
Best for: Gamers and reviewers who benchmark frame rates and frame times precisely
Visit capframex.com
Starting priceFree
Free planYes
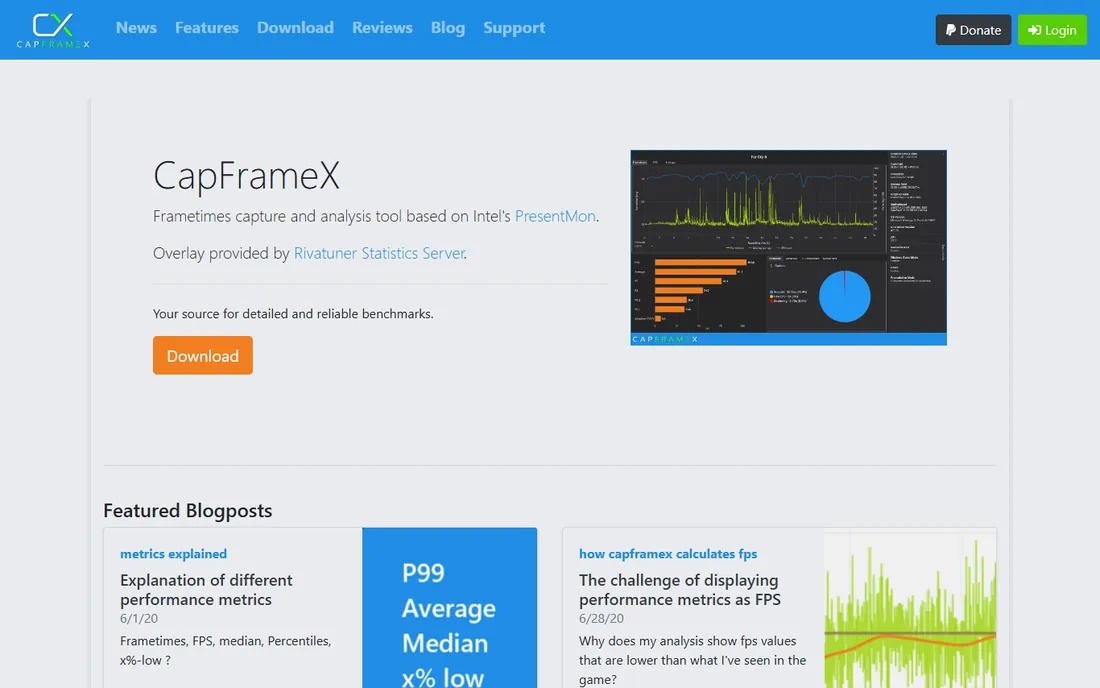
Most monitors tell you average FPS, which hides the stutters that ruin how a game feels. CapFrameX captures frame times through Intel's PresentMon backend and analyzes them properly: averages, 1% and 0.1% lows and percentile distributions that show whether a settings change actually smoothed things out. It pairs with RivaTuner Statistics Server to display the numbers as an in-game overlay, and the project is free and open source with both installer and portable builds.
This is a specialist, not a generalist. CapFrameX will not report motherboard voltages or drive health the way HWiNFO does, and its interface assumes you care about benchmarking methodology. For reviewers, competitive gamers tuning settings, and anyone chasing a stutter, it is the right tool. For keeping an eye on temperatures day to day, pick one of the broader monitors above and let CapFrameX handle test day.
What we like- Accurate frame-time capture using Intel PresentMon
- Detailed benchmark analysis with percentile statistics
- Free and open source
Watch out for- Focused on benchmarking rather than general hardware health
- Setup pairs with RTSS for the overlay
How we chose
We started from vendor documentation, pricing pages and download pages, and cross-checked features against public reviews on G2, Capterra and Reddit threads where PC builders discuss what they actually run. Every tool on this list is actively maintained, works on current hardware, and genuinely reports GPU sensors rather than estimating them. We favored tools with a clear free path for home users, kept one paid suite for buyers who also need stress testing, and made sure macOS was represented. We did not run lab benchmarks of the monitors themselves.
What to check before you install a monitor
Picking a GPU monitor is mostly about matching the tool to the job. A gamer needs an overlay and fan control. A technician diagnosing crashes needs logging and the deepest sensor list available. Start from the job and the choice narrows fast.
Sensor coverage
At minimum, a GPU monitor should report GPU temperature, hotspot or junction temperature, clock speeds, fan speed, power draw and memory usage. HWiNFO and AIDA64 go further with per-rail voltages and, on recent AMD cards, per-chip VRAM temperatures. If you are chasing a throttling problem, that extra detail is what separates a guess from a diagnosis.
Overhead and accuracy
A monitor that slows the system it measures is worse than useless. The tools here are known for low overhead, but polling hundreds of sensors at high frequency still costs CPU cycles, so set a sensible polling interval. When two tools disagree on a temperature, check whether they are showing different sensors, such as edge temperature versus hotspot, which can differ by 15 degrees or more.
Alerts, logging and overlays
Decide how you want the data delivered. An in-game overlay (Afterburner, CAM, Adrenalin) suits active gaming. Logging to a file (HWiNFO, GPU-Z, CapFrameX, Adrenalin) suits diagnosing problems after they happen. Alerts (HWiNFO, iStat Menus) suit unattended machines. Few free tools do all three well, so this is the feature that most often justifies a paid option.
For most home users, free tools cover everything that matters. MSI Afterburner handles gaming overlays and fan control, HWiNFO handles deep diagnostics, GPU-Z handles card identification, and NZXT CAM handles the pretty dashboard. You can monitor a GPU thoroughly for years without spending anything.
Paid options earn their price in two situations. The first is professional use: technicians validating systems and reviewers publishing benchmarks benefit from AIDA64's stress testing and reporting or HWiNFO Pro's remote monitoring. The second is macOS, where iStat Menus is effectively the only serious choice. Outside those cases, treat a paid GPU monitor as a convenience purchase, not a necessity, and trial it first.
Frequently asked questions
What temperature should my GPU run at?
Most modern GPUs are designed to run between 65 and 85 degrees Celsius under full load. Many cards do not throttle until the hotspot temperature passes 100 to 110 degrees, depending on the model. What matters more than the peak is the pattern: a sudden climb to temperatures you have never seen usually means dust, a dead fan or dried thermal paste.
Do I need GPU monitoring software if I do not overclock?
It still helps. Monitoring catches failing fans, dust-clogged heatsinks and background crypto miners before they cause damage, and it tells you whether a new game is actually stressing your card. A lightweight tool like HWMonitor or NZXT CAM costs nothing and takes seconds to check.
Can monitoring software damage my GPU?
Reading sensors cannot damage anything. Changing clocks, voltages and fan curves can, if you push values the card cannot handle. If you only monitor and never touch the sliders, the risk is zero.
Why do two tools show different GPU temperatures?
They are usually showing different sensors. A GPU has an edge temperature, a hotspot and a memory junction temperature, and these can differ by 10 to 20 degrees under load. Check which sensor each tool labels before assuming one of them is wrong.
Is there good GPU monitoring software for Mac?
Yes, but the field is thin. iStat Menus is the polished option, with menu-bar GPU stats and Apple Silicon support. macOS also exposes some GPU data through Activity Monitor's GPU history window, though it lacks temperatures. Most of the free Windows tools on this list have no Mac version.
Sources we checked (12)
- https://www.msi.com/Landing/afterburner/graphics-cards
- https://www.hwinfo.com/
- https://www.techpowerup.com/download/techpowerup-gpu-z/
- https://www.cpuid.com/softwares/hwmonitor.html
- https://www.aida64.com/
- https://www.nzxt.com/camapp
- https://www.amd.com/en/resources/support-articles/faqs/DH3-038.html
- https://www.capframex.com/
- https://github.com/CXWorld/CapFrameX
- https://bjango.com/mac/istatmenus/
- https://www.techspot.com/downloads/433-aida64-extreme-edition.html
- https://www.nationalcybersecurity.com/cpuid-breach-distributes-stx-rat-via-trojanized-cpu-z-and-hwmonitor-downloads-hacking-cybersecurity-infosec-comptia-pentest-hacker/
Is your product missing or out of date?
We review this list regularly. Vendors can request a listing, send updated pricing or ask about featured placement.

Shihab Mia · Founder, Rankite
Shihab has spent more than a decade helping SaaS and e-commerce brands grow through search. He writes Rankite's software buying guides from pricing pages, documentation and public user reviews. More about Shihab.