How we make this list: we compare pricing pages, product documentation and public user reviews. Rankite is independent; if a vendor ever pays for a featured spot, that listing is clearly labeled Partner.
Key takeaways
- Seeq and TrendMiner dominate industrial time series analytics, built for process engineers working with historian data.
- Nixtla's TimeGPT brings foundation-model forecasting to developers with a free tier and a simple API.
- Grafana and InfluxDB are the open-source backbone: free to start, with paid cloud tiers when you scale.
- Anodot and DataRobot suit business teams that want anomaly detection and forecasting without building models.
- Splunk fits IT and security operations where time series data means logs and machine data, not sensor readings.
Quick comparison
| Tool | Best for | Starting price | Free plan |
|---|
 Seeq Seeq | Process manufacturing analytics | See website | Free trial |
 TrendMiner TrendMiner | Self-service industrial analytics | See website | Free trial |
 Nixtla Nixtla | API-first time series forecasting | Free | Yes |
 Anodot Anodot | Autonomous business anomaly detection | See website | No |
 Splunk Splunk | IT and security time series data | See website | Free trial |
 Grafana Grafana | Open-source visualization and alerting | Free | Yes |
 InfluxDB InfluxDB | Time series database | Free | Yes |
 DataRobot DataRobot | Enterprise AI forecasting | See website | Free trial |
 Visplore Visplore | Visual root-cause analysis | See website | No |
Is your product missing or out of date?
We review this list regularly. Vendors can request a listing, send updated pricing or ask about featured placement.
Time series analysis means different things to different teams. Process engineers want to search sensor data and diagnose production issues (Seeq, TrendMiner, Visplore). Data scientists want forecasting APIs and model tooling (Nixtla, DataRobot). IT teams want to watch logs and metrics (Splunk, Grafana, InfluxDB). Business analysts want anomaly alerts without code (Anodot). Match the tool to your team before comparing features.
Starting priceSee website
Free planFree trial

Seeq was the first application dedicated to process data analytics, and it still defines the category. It connects to historians like OSIsoft PI, Honeywell PHD and AspenTech IP.21, then lets engineers search, cleanse, model and monitor time series data without writing code. Pattern search across years of sensor data is the standout capability.
Pricing is enterprise-grade and quote-based, with third-party estimates around $500 per user per month. It only makes sense if you have process data infrastructure. For manufacturing and process industries, though, it is the reference implementation.
Implementation is not a weekend project. Getting value from Seeq means connecting it to your historian, which requires IT cooperation and clean tag data; most buyers budget several weeks for deployment plus training for engineers new to the workflow. Support quality is generally rated well, with dedicated customer success for enterprise accounts and an active user community around process analytics. The main limitation is dependence on that historian infrastructure: without years of tagged sensor data, the pattern search that justifies the price has little to work with.
What we like- Purpose-built for process historian data
- Fast search and pattern-finding
- Strong collaboration features
Watch out for- Enterprise pricing
- Requires historian infrastructure to shine
Starting priceSee website
Free planFree trial
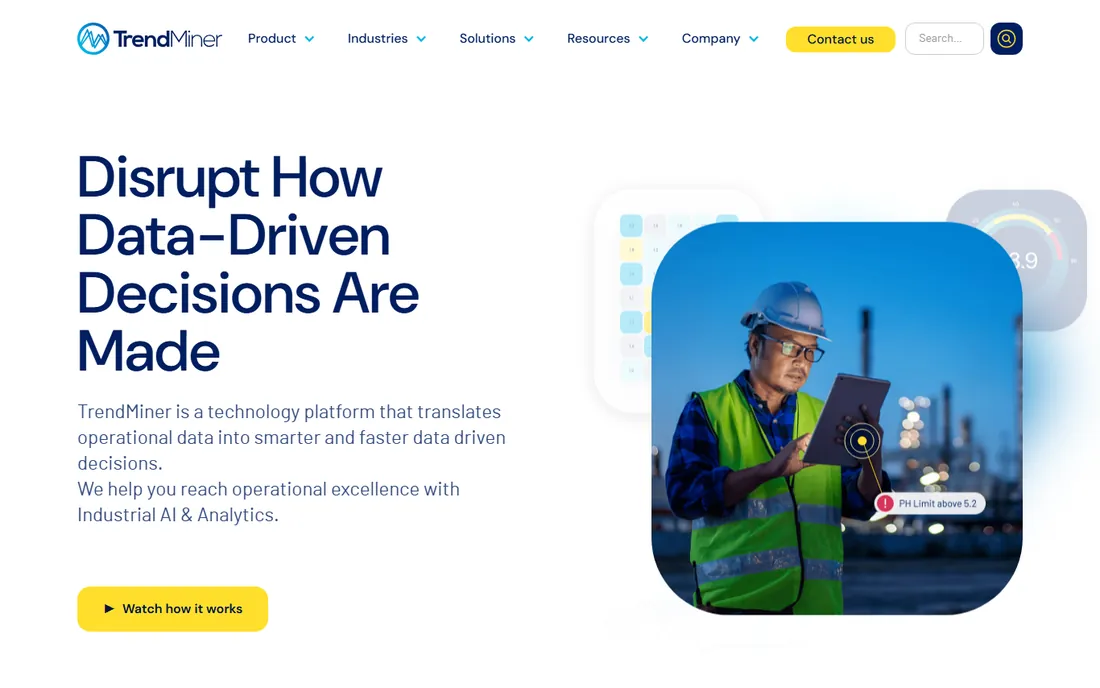
TrendMiner, part of Software AG, gives process engineers self-service analytics over industrial time series data: search for patterns, diagnose deviations, build monitors and predict issues. The visual workflow is approachable for engineers who are not data scientists, and it handles large historian datasets quickly.
Like Seeq, it sells through quotes and demos rather than price pages, with estimates starting around $1,000 a month for base licenses. Choose between the two on workflow fit and existing vendor relationships; functionally they overlap heavily.
Deployment tends to move faster than Seeq's for pure diagnostics work, since the visual workflow needs less configuration, but you still need historian connectivity and trained engineers to get full value. TrendMiner's support runs through Software AG's enterprise channels, which is solid if unglamorous. One limitation worth noting: the integration ecosystem is narrower than Seeq's, so if you need deep connections to third-party analytics or custom APIs, confirm those exist before committing.
What we like- Intuitive visual analytics for engineers
- Fast on large historian datasets
- Strong diagnostic workflows
Watch out for- Quote-based pricing
- Narrower ecosystem than Seeq
Starting priceFree
Free planYes
Nixtla built TimeGPT, described as the first foundation model for time series data, trained on over 100 billion data points. The pitch is compelling: a few lines of Python and you get forecasts and anomaly detection without training models, even on sparse or irregular series. The free tier lets developers experiment before paying.
It is a developer tool, not a business dashboard; non-programmers will struggle. And the hosted API means your forecasting depends on their service. For data teams that want modern forecasting without the modeling overhead, it is the most interesting new entry here.
On the practical side, TimeGPT is priced per forecast, with a generous free tier for experimentation and paid tiers that scale with usage. Rate limits apply on lower tiers, so production workloads need the paid plans. Nixtla also offers fine-tuning options for teams with domain-specific series, and documentation is solid for a young product. Support runs through community channels and email; there is no enterprise phone line yet. The open-source NeuralForecast library from the same team is worth knowing about if you want to prototype locally before paying for the API.
What we like- TimeGPT foundation model for zero-shot forecasting
- Simple Python SDK
- Free tier to start
Watch out for- API dependency for the hosted model
- Less suited to non-programmers
Starting priceSee website
Free planNo
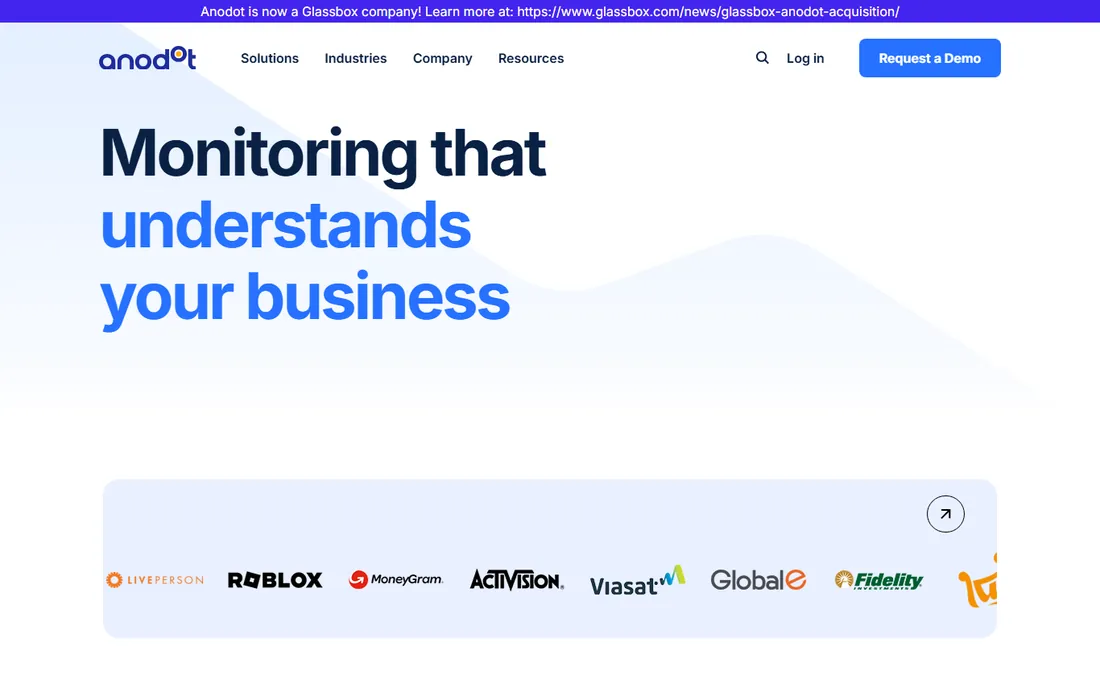
Anodot applies machine learning to watch business metrics continuously, flagging anomalies and correlating root causes across parameters without anyone writing rules. Customers in e-commerce, fintech and telecom use it to catch revenue-impacting incidents that dashboards miss.
There is no free trial to click through; evaluation goes through sales. Pricing is enterprise. It fits organizations where a missed anomaly costs real money and the team wants monitoring that runs itself.
Setup is guided: Anodot's team helps connect data sources such as Snowflake, BigQuery, Salesforce and ad platforms, then the models learn normal patterns over a few weeks of history. The limitation is that it needs that history to work well; brand-new metrics have nothing to learn from. Pricing is custom and typically annual. Support is enterprise-grade with named contacts, which matters because you will lean on them during the initial tuning period when false positives are highest.
What we like- Continuous AI monitoring across business metrics
- Automatic root-cause correlation
- Enterprise scale
Watch out for- No self-serve trial
- Pricing requires sales engagement
Starting priceSee website
Free planFree trial
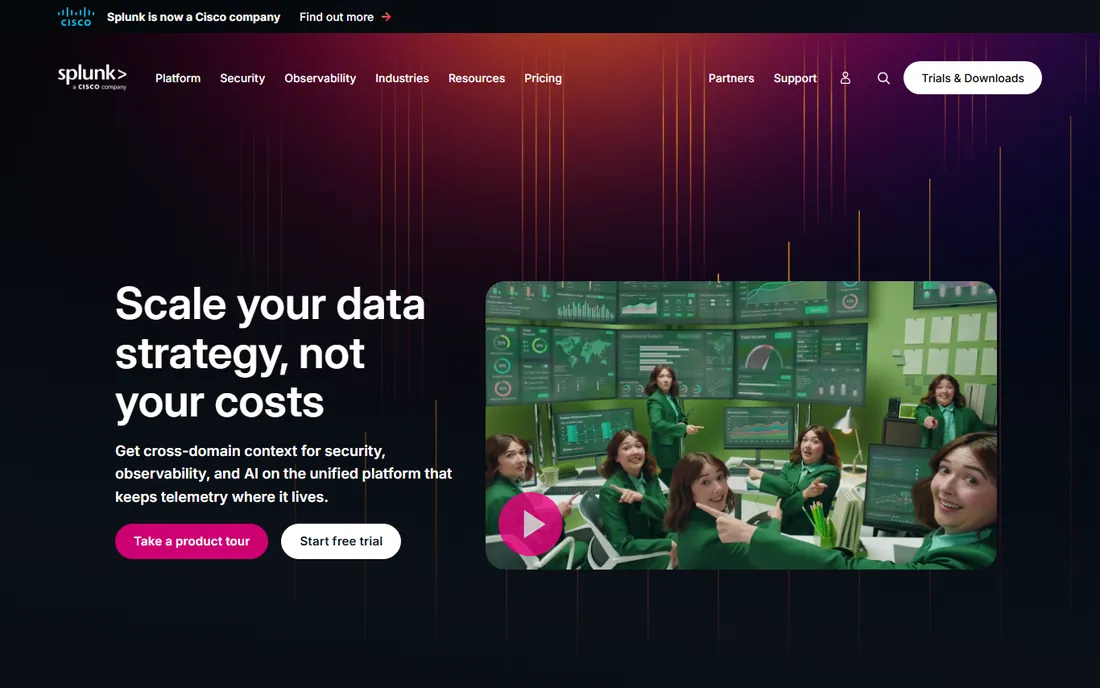
Splunk is the heavyweight for time-stamped machine data: logs, metrics, events. Its search processing language turns billions of events into trends, alerts and dashboards, and the security and observability apps built on top are industry standards.
Costs scale with ingested data volume, which surprises first-time buyers, and it is not a forecasting tool in the statistical sense. But when your time series is server logs and you need answers fast, nothing else operates at this scale.
Plan for implementation cost, not just license cost. Splunk almost always needs a trained admin or consultant to design indexes, manage retention and keep search performance healthy, and that expertise is expensive. Pricing moved toward workload-based models, but data volume still drives the bill. The upside is the ecosystem: thousands of apps, a huge talent pool and documentation for almost every use case. If your team already runs Splunk, adding time series monitoring is trivial; adopting it fresh just for time series is overkill.
What we like- Unmatched for log and machine data at scale
- Powerful search language
- Huge app ecosystem
Watch out for- Pricing scales steeply with data volume
- Overkill for simple forecasting
Starting priceFree
Free planYes
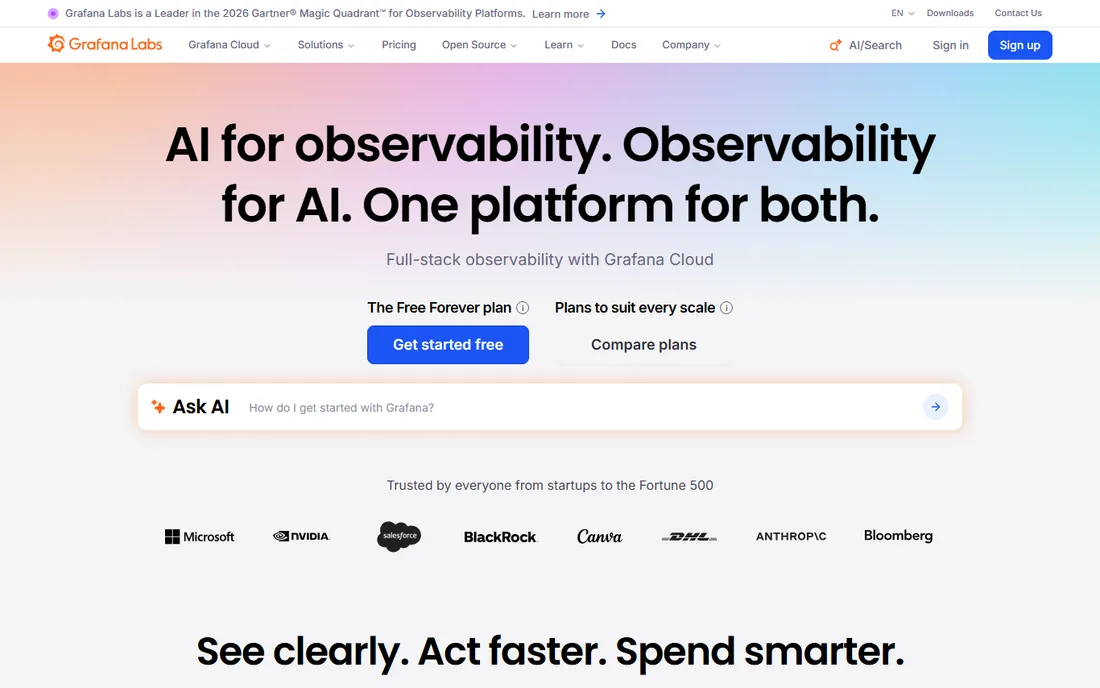
Grafana is the open-source standard for visualizing time series data and alerting on it. Point it at Prometheus, InfluxDB, or dozens of other sources and build dashboards in minutes. The plugin ecosystem covers nearly every data source imaginable, and Grafana Cloud offers a managed path when self-hosting gets old.
It visualizes and alerts; it does not forecast or run ML models natively. For monitoring infrastructure, applications and IoT data on a budget, it is the default choice of half the industry.
Self-hosting is genuinely free but not free of effort: you manage upgrades, storage and alerting reliability yourself. Grafana Cloud removes that burden with a free tier and paid plans based on usage, which many small teams prefer. The community is enormous, so troubleshooting rarely dead-ends, though official support requires a paid plan. One limitation worth knowing: complex alerting rules and long-term metric storage take configuration to get right, and high-cardinality data can strain self-hosted setups.
What we like- Free and open source
- Beautiful dashboards
- Huge plugin ecosystem
Watch out for- You manage the infrastructure
- Advanced features sit in paid tiers
Starting priceFree
Free planYes
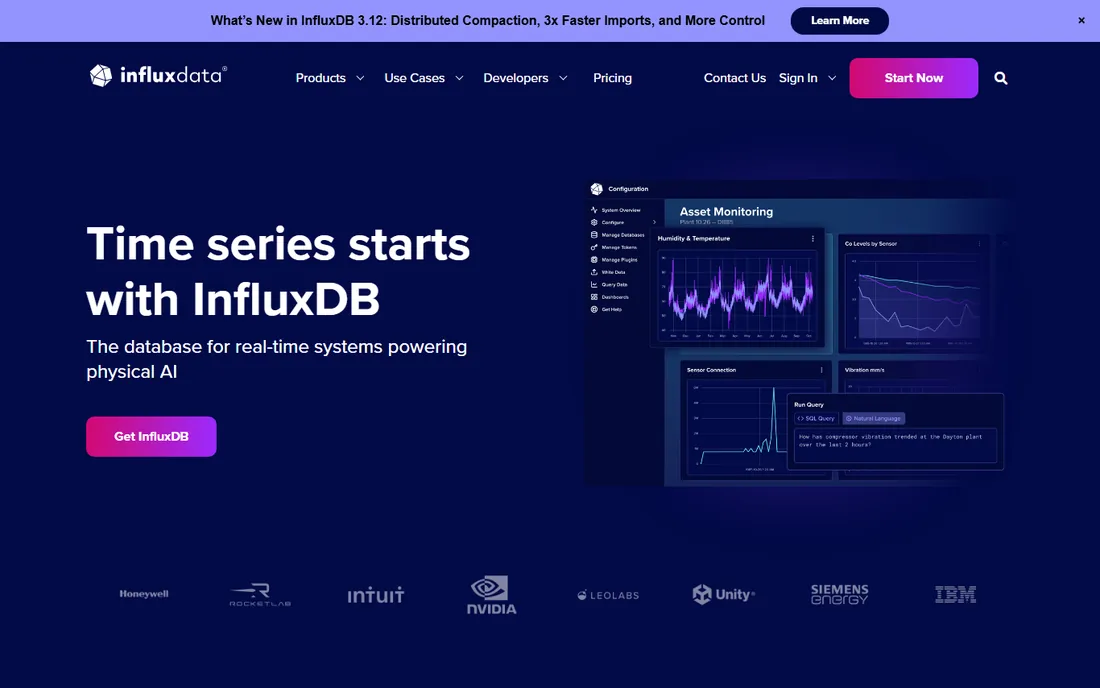
InfluxDB is the database underneath many time series stacks: optimized for high-ingestion timestamped data, with downsampling, retention policies and fast range queries that relational databases handle poorly. The open-source version is free, with InfluxDB Cloud adding managed hosting.
You still need Grafana or code on top for visualization and analysis. Choose it when you are building a time series platform and need storage engineered for the job.
The learning curve is real. InfluxDB's original Flux query language is powerful but unfamiliar, though InfluxDB 3.x added SQL support that lowers the bar considerably. Migration from an existing database takes planning around retention policies and downsampling rules. The company offers commercial support and a managed cloud, and documentation is thorough. For IoT and DevOps teams already comfortable with time series concepts, it slots in naturally; for analysts expecting a BI tool, pair it with Grafana from day one.
What we like- Purpose-built for time series storage
- Fast ingestion and queries
- Free open-source tier
Watch out for- It is a database, not an analytics UI
- Learning Flux or SQL takes effort
Starting priceSee website
Free planFree trial
DataRobot's automated machine learning platform includes serious time series forecasting: automated feature engineering, backtesting and model selection without hand-tuning. Governance, deployment and monitoring features suit regulated enterprises.
It is priced for enterprises and feels heavy for a team that just needs next quarter's demand forecast. But for organizations standardizing ML across many forecasting use cases with audit requirements, the platform approach pays off.
Expect a real implementation cycle: weeks of onboarding, data preparation and model validation before forecasts go live, typically with a dedicated solutions architect. That is the price of the governance features regulated industries need. Integrations cover the usual data warehouses and BI tools, and deployment options include managed cloud and on-premise. Support is white-glove for enterprise contracts. Smaller teams should be honest about whether they need this machinery; a Python script with a forecasting library handles simple cases for free.
What we like- Automated machine learning for forecasting
- Strong governance features
- Enterprise support
Watch out for- Expensive
- Heavier than needed for simple forecasting tasks
Starting priceSee website
Free planNo
Visplore focuses on visual analytics for industrial data: systematic root-cause analysis of KPI deviations, production losses and quality issues across process data. On-premise deployment appeals to manufacturers with strict data policies, and the structured workflow makes investigations repeatable.
Evaluation goes through the vendor, and the community is smaller than the category leaders. For European manufacturers in particular, it is a credible alternative to the bigger names with a distinct visual methodology.
Deployment is on-premise by design, which appeals to manufacturers that keep process data inside the plant network. That also means your IT team handles installation and updates. Training is part of the package since the visual methodology is proprietary; plan for workshops before engineers become productive. Support comes directly from the vendor, and buyers report responsive help, though the smaller community means fewer peer examples than Seeq's user base. European customers get local-language support, which matters in this market.
What we like- Systematic visual analytics for engineers
- On-premise deployment
- Structured deviation analysis
Watch out for- No self-serve evaluation
- Smaller community than Seeq or TrendMiner
Forecasting future demand, detecting anomalies in production, monitoring infrastructure, and exploring historical patterns are different jobs. Forecasting points to Nixtla or DataRobot; anomaly detection to Anodot; industrial exploration to Seeq or TrendMiner; infrastructure monitoring to Grafana and InfluxDB. Define the question first and the shortlist writes itself.
Budget shapes the shortlist too. Open-source Grafana plus InfluxDB costs nothing but engineering time, which suits teams with DevOps skills and no procurement budget. Industrial tools are the opposite: five-figure annual contracts are normal, so get the vendor on a pilot with your own historian data before signing anything. And always trial with real data: a demo on the vendor's clean dataset tells you nothing about how the tool handles your noisy sensors, your sparse logs or your irregular sales series.
How we chose
We compared the tools most cited for time series analysis across industrial, business and IT contexts in 2026, verifying pricing transparency and trial availability against vendor sites. We weighted fit for the stated use case, ease of adoption and total cost. We did not benchmark forecasting accuracy ourselves.
Frequently asked questions
What is time series analysis software?
Software designed to work with data points ordered in time: storing them efficiently, visualizing trends, detecting anomalies, and forecasting future values. Examples range from industrial tools like Seeq to open-source stacks like InfluxDB plus Grafana. The best choice depends on whether you need real-time monitoring, deep historical exploration or forward-looking forecasts, since few tools do all three well.
Do I need a time series database?
If you ingest high-frequency timestamped data, yes; purpose-built databases like InfluxDB outperform general databases by orders of magnitude on range queries and downsampling. For occasional analysis of small datasets, a spreadsheet or Python is fine. Cloud-managed options like InfluxDB Cloud reduce the operational burden if you do not want to run database infrastructure yourself.
What is the difference between monitoring and forecasting?
Monitoring watches current data for threshold breaches and anomalies (Grafana, Anodot). Forecasting predicts future values from historical patterns (Nixtla, DataRobot). Many projects need both, which is why stacks combine tools. Budget for both if your goal is reliability engineering: you need to see what is happening now and predict what happens next.
Can Excel handle time series analysis?
For small, simple datasets, yes. Excel breaks down on high-frequency data, millions of rows, real-time ingestion and automated anomaly detection. That is where dedicated tools earn their keep. The usual breaking point is around a few hundred thousand rows, or when you need automated refreshes and alerts that run without you.
How much does industrial time series software cost?
Enterprise industrial platforms like Seeq and TrendMiner are quote-based, with third-party estimates from roughly $500 to $1,000+ per user per month. Developer and open-source options like Nixtla's free tier, Grafana and InfluxDB cost nothing to start. Always ask what implementation and training cost on top of the license; for industrial tools those services can rival the subscription itself.
Sources we checked (9)
- https://www.seeq.com/
- https://www.trendminer.com/
- https://www.nixtla.io/
- https://www.anodot.com/
- https://www.splunk.com/
- https://www.grafana.com/
- https://www.influxdata.com/
- https://www.datarobot.com/
- https://www.visplore.com/
Is your product missing or out of date?
We review this list regularly. Vendors can request a listing, send updated pricing or ask about featured placement.

Shihab Mia · Founder, Rankite
Shihab has spent more than a decade helping SaaS and e-commerce brands grow through search. He writes Rankite's software buying guides from pricing pages, documentation and public user reviews. More about Shihab.