How we make this list: we compare pricing pages, product documentation and public user reviews. Rankite is independent; if a vendor ever pays for a featured spot, that listing is clearly labeled Partner.
Key takeaways
- Zabbix and Checkmk Raw are free and open source, and they scale to thousands of servers without license fees.
- Datadog ($15/host/month) and New Relic (free 100 GB tier) are the leading SaaS options for cloud-native teams.
- PRTG gives you 100 sensors free, which covers a small server room at no cost.
- Nagios XI (from $1,995) and SolarWinds SAM (from $1,500/year) suit traditional IT shops that want on-premises control.
- Site24x7 starts around $9 per month and bundles server, website, and network monitoring for small teams.
Quick comparison
| Tool | Best for | Starting price | Free plan |
|---|
 Datadog Datadog | cloud-native full-stack monitoring | From $15/host/month (Infrastructure Pro) | Free trial (14 days) |
 New Relic New Relic | usage-based observability with a free tier | Free (100 GB/month); paid plans from See website | Yes (100 GB/month data ingest free) |
 Zabbix Zabbix | free enterprise monitoring on your hardware | Free (open source) | Yes (fully free and open source) |
 Nagios XI Nagios XI | traditional IT with existing Nagios plugins | From $1,995 (Nagios XI) | Yes (Nagios Core is free and open source) |
 PRTG PRTG | Windows-friendly auto-discovery monitoring | See website (paid tiers beyond 100 free sensors) | Yes (100 sensors free) |
 SolarWinds SAM SolarWinds SAM | hybrid IT with application dependency mapping | From $1,500/year (Server & Application Monitor) | Free trial |
 Site24x7 Site24x7 | budget all-in-one for small teams | From $9/month | Free trial |
 Checkmk Checkmk | rule-based monitoring at enterprise scale | Free (Raw edition); Enterprise from See website | Yes (Raw edition is free and open source) |
Is your product missing or out of date?
We review this list regularly. Vendors can request a listing, send updated pricing or ask about featured placement.
The best server monitoring software
A server outage you discover from an angry customer is the most expensive kind. Every minute of downtime costs revenue, erodes trust, and pulls your team into firefighting instead of building. The wrong monitoring tool fails in subtler ways too: alert fatigue that trains everyone to ignore warnings, per-metric pricing that explodes with growth, or a deployment model that does not fit how your infrastructure actually runs. Get this choice right and problems surface at 3 a.m. as a quiet page, not as a Monday-morning crisis.
Starting priceFrom $15/host/month (Infrastructure Pro)
Free planFree trial (14 days)
Datadog is the reference platform for cloud-native monitoring. One agent per host feeds metrics, logs, traces, and security signals into a single interface, with hundreds of integrations for AWS, Kubernetes, databases, and just about everything else. For teams running microservices, the ability to jump from an alert to the relevant log line to the trace is the workflow that sells it.
The honest catch is the meter. Per-host pricing plus charges for logs and custom metrics means a growing estate produces a growing bill, and teams that do not manage data volume get surprised. Disciplined tagging and log filtering keep costs sane. If your infrastructure lives mostly in the cloud, it is the strongest default on this list.
What we like- Huge integration catalog covering cloud, containers, and apps
- Unified view of metrics, logs, and traces
- Strong anomaly detection
Watch out for- Costs scale with hosts and data volume, so bills need watching
- Broad feature set takes time to learn
Starting priceFree (100 GB/month); paid plans from See website
Free planYes (100 GB/month data ingest free)
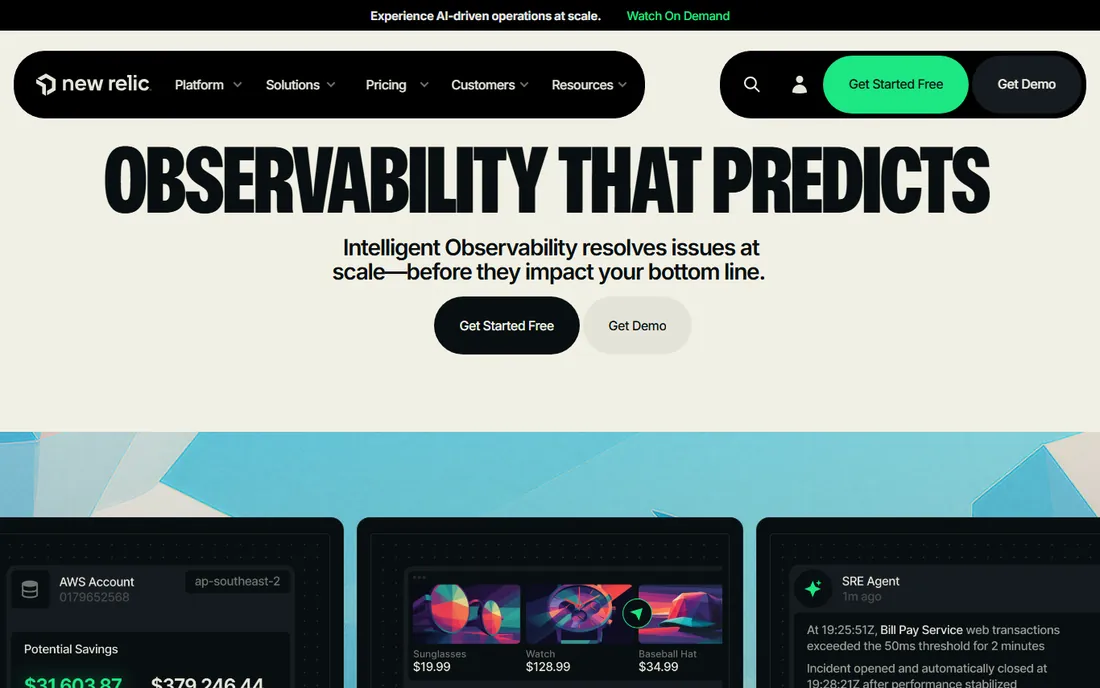
New Relic rebuilt its pricing around a simple idea: 100 GB of data ingest per month is free, and you pay per gigabyte beyond that plus per-user seats. For small estates, that means genuine full-stack observability at zero cost, no trial clock ticking. The platform covers infrastructure, APM, logs, browser, and synthetics on one data model, and the homepage confirms full platform access without a credit card.
Above the free tier, the bill tracks your data volume, which rewards disciplined telemetry but punishes noisy setups. It is now privately held under Francisco Partners, and development continues across the platform. Teams that want to start free and scale spend gradually should look here first.
What we like- Generous free tier with no credit card required
- Full platform access on one data model
- 800+ integrations
Watch out for- Pricing above the free tier is usage-based and needs monitoring
- Server monitoring is one module among many
Starting priceFree (open source)
Free planYes (fully free and open source)
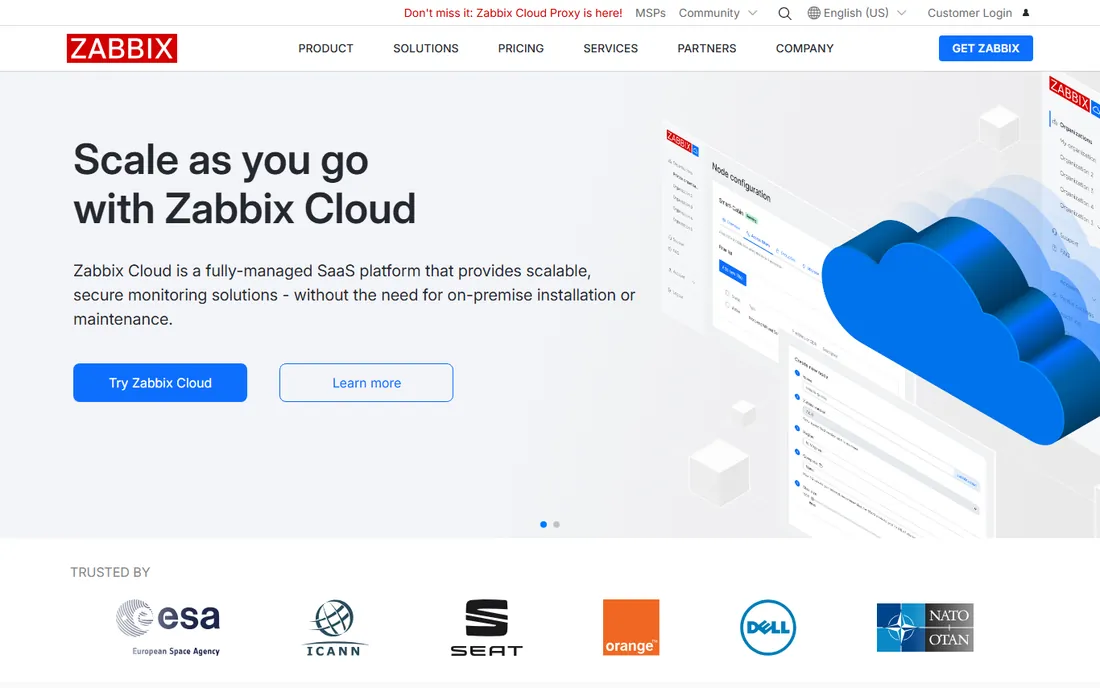
Zabbix is the open-source workhorse of enterprise monitoring. It monitors servers, networks, applications, and cloud resources with agents or agentless via SNMP, and its templating system lets you define monitoring once and apply it across thousands of hosts. There are no license fees and no per-device charges, so the total cost is your hardware and your time. A managed Zabbix Cloud exists if you want the platform without operating it.
The tradeoff is the learning curve. Configuration is powerful but not friendly, and the interface shows its age. You need someone on the team who enjoys this kind of tooling. For organizations with Linux skills and a large estate, nothing commercial touches the price.
What we like- No license fees at any scale
- Agent and agentless monitoring with strong templating
- Optional managed cloud available
Watch out for- Interface feels dated next to SaaS rivals
- Setup and tuning require real expertise
#4
Nagios XI
Best for: traditional IT with existing Nagios plugins
Visit nagios.com
Starting priceFrom $1,995 (Nagios XI)
Free planYes (Nagios Core is free and open source)
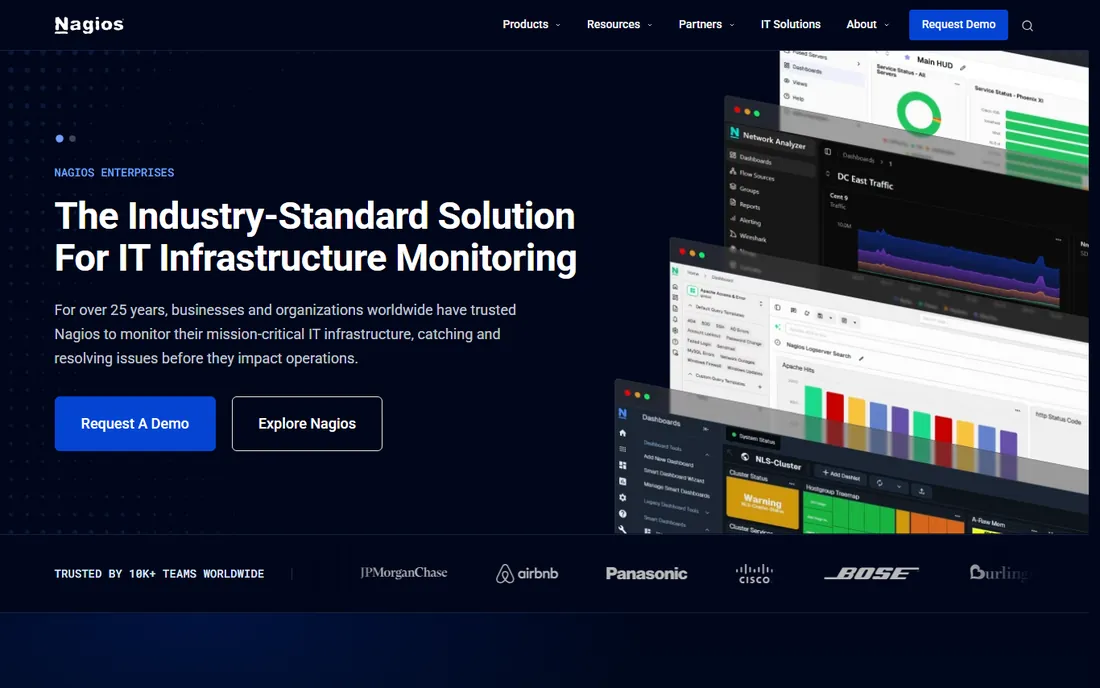
Nagios has monitored infrastructure for over two decades, and its plugin ecosystem remains unmatched: if something can be checked, someone has written a Nagios plugin for it. Nagios XI adds the web interface, wizards, dashboards, and reporting on top of the free Nagios Core, with licensing by node count fixed at purchase. Your data never leaves your infrastructure, which matters for regulated and air-gapped environments.
The honest catch is that it is a product of its era. Configuration mixes web wizards with config files, and the $1,995 entry price for XI is real money compared with free alternatives. Shops that already run Nagios plugins have every reason to stay; new deployments should weigh it against Zabbix before buying.
What we like- Enormous plugin library covers almost anything
- Fixed per-node licensing keeps costs predictable
- Runs fully on your hardware
Watch out for- XI licensing is a significant upfront cost
- Configuration still involves files and wizards rather than modern UI flows
Starting priceSee website (paid tiers beyond 100 free sensors)
Free planYes (100 sensors free)
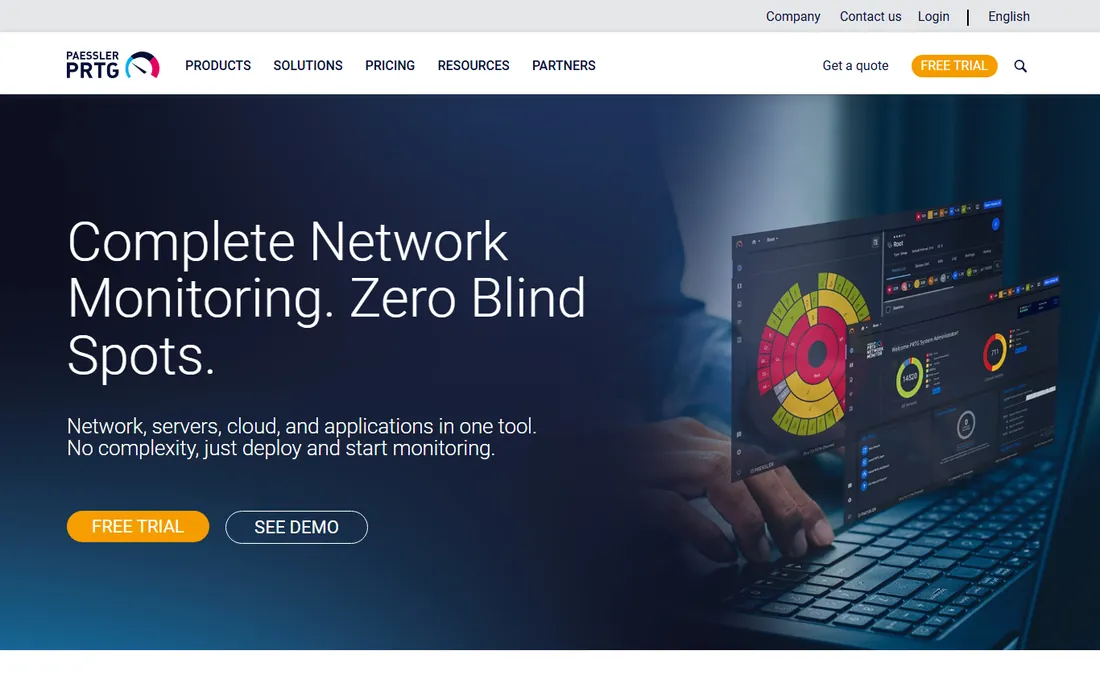
PRTG by Paessler is the fastest path to real monitoring for Windows-centric shops. Auto-discovery finds your devices, pre-configured sensors start collecting immediately, and the whole thing runs from one dashboard covering network, servers, cloud, and applications. The first 100 sensors are free forever, which covers a small server room or office network at zero cost.
Beyond the free tier, you pay per sensor, and dense environments with many metrics per device can consume sensors quickly. It is also at its most comfortable on Windows infrastructure. For lean IT teams that want results this week rather than a project, it is hard to beat for ease of deployment.
What we like- Auto-discovery gets you monitoring in hours
- Pre-configured sensors need little tuning
- Intuitive for Windows-centric teams
Watch out for- Sensor-based pricing can climb on dense estates
- Primarily a Windows-server product at heart
Starting priceFrom $1,500/year (Server & Application Monitor)
Free planFree trial
SolarWinds Server & Application Monitor focuses on the layer above raw server health: how applications, services, and dependencies behave across your hybrid environment. Its templates cover hundreds of commercial applications out of the box, and dependency mapping shows how a failing component affects the services above it. It is deeply entrenched in enterprise IT, with hundreds of thousands of customers worldwide.
The honest catch is the product sprawl. SolarWinds sells monitoring as modules, and a full observability stack means several licenses. Pricing starts around $1,500 per year for SAM, and there is no free tier. Traditional IT organizations with complex hybrid estates get the most value; cloud-native teams usually prefer Datadog or New Relic.
What we like- Deep application and dependency visibility across hybrid estates
- Strong template library for commercial apps
- Widely deployed in enterprises
Watch out for- Modular product line means costs stack up
- No free tier, trial only
Starting priceFrom $9/month
Free planFree trial
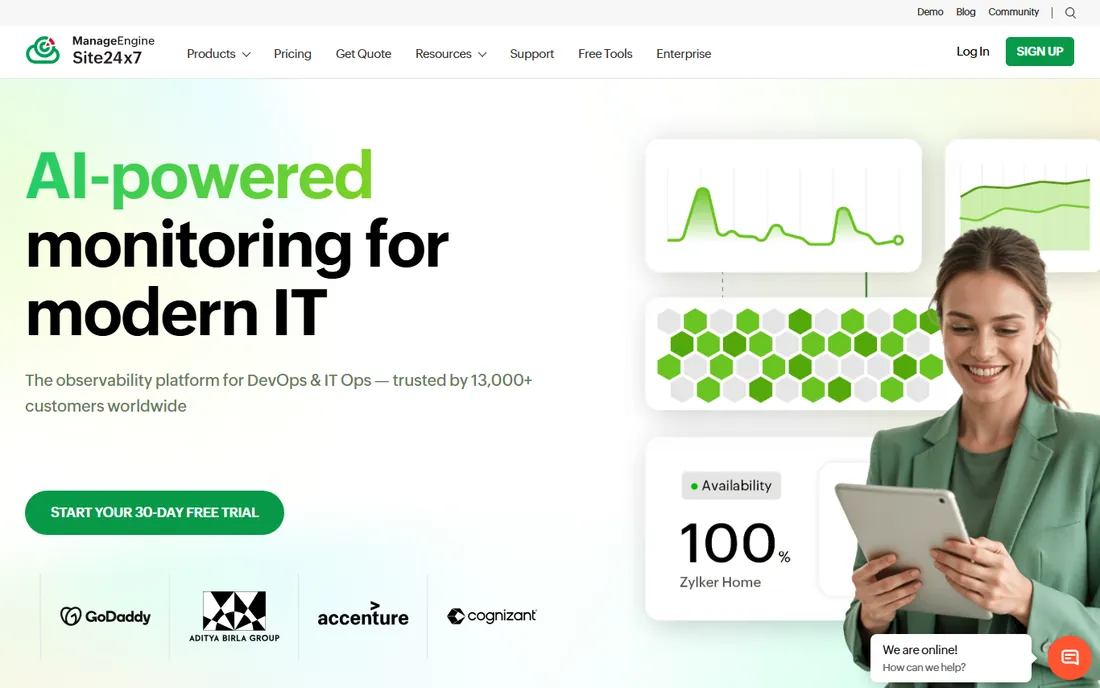
Site24x7, part of the Zoho family, bundles website, server, cloud, network, and application monitoring into one inexpensive SaaS platform starting around $9 per month. For a small team that needs to watch servers, uptime, and a few apps without buying three tools, it is the value pick. Setup is quick, AI-powered anomaly detection reduces alert noise, and public status pages come included.
At enterprise scale it shows limits. Deep customization, advanced analytics, and massive-estate management trail the bigger platforms. But for small and mid-size teams watching the budget, it covers the fundamentals at a fraction of the cost of Datadog or SolarWinds.
What we like- One low price covers servers, websites, networks, and APM
- Easy setup with AI-assisted alerting
- Status pages included
Watch out for- Less depth at enterprise scale
- Dashboard customization lags behind leaders
Starting priceFree (Raw edition); Enterprise from See website
Free planYes (Raw edition is free and open source)
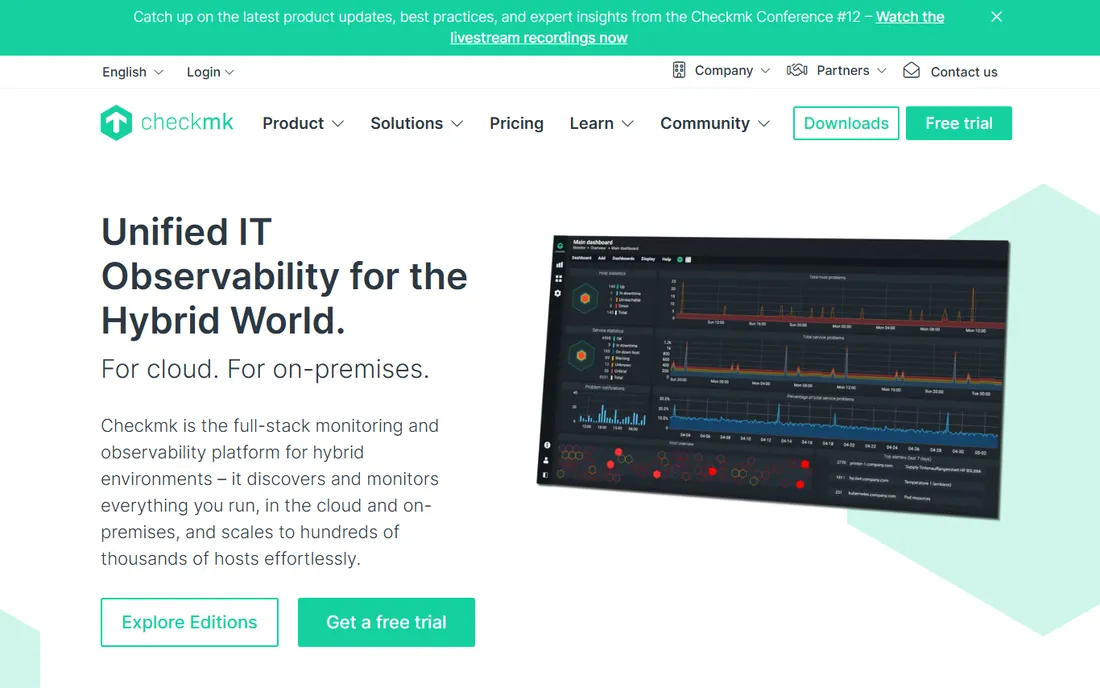
Checkmk grew out of the Nagios world and rebuilt monitoring around a rule-based configuration model that scales remarkably well. One rule defines monitoring for a whole class of hosts, so adding your five-hundredth server is no more work than the fifth. The free Raw edition is fully usable, while Enterprise adds features like advanced reporting, the agent bakery, and AI-assisted root cause summaries.
The learning curve is real. Thinking in rules rather than per-host config takes adjustment, and Enterprise pricing requires talking to sales. For distributed estates and MSPs that need multi-tenancy and scale without license sprawl, it is one of the strongest technical choices here.
What we like- Rule-based configuration scales cleanly to thousands of hosts
- Huge integration catalog
- Free Raw edition is genuinely capable
Watch out for- Enterprise pricing is quote-based
- Learning the rule system takes effort
How we chose
We compared eight server monitoring platforms spanning SaaS, self-hosted, and open-source models, checking vendor homepages and documentation in October 2026, alongside public pricing benchmarks and buyer discussions on review sites and engineering forums. We prioritized server monitoring depth, alerting quality, pricing transparency, deployment flexibility, scalability, and fit for different team sizes. No vendor paid for placement, and nothing here is based on hands-on product testing.
Start with where your servers live. Cloud and container estates point toward Datadog or New Relic; on-premises Windows shops fit PRTG or SolarWinds; Linux-heavy teams with in-house skills get the most from Zabbix or Checkmk. The deployment model decision eliminates half the list immediately.
Then model the cost at your scale, not at the entry tier. Per-host, per-sensor, and per-gigabyte meters all grow with your estate, so price the tool against your actual server count plus expected growth. Finally, run a proof of concept on your noisiest systems before buying. Alert quality is the thing you cannot evaluate from a demo, and it is the thing that decides whether the tool gets used or muted.
Open source vs. SaaS monitoring: the real tradeoff
Open-source tools like Zabbix, Checkmk Raw, and Nagios Core cost nothing in licenses and keep your data on your hardware. The price you pay is engineering time: setup, tuning, upgrades, and on-call knowledge live with your team. For organizations with the skills, that trade is excellent.
SaaS tools like Datadog, New Relic, and Site24x7 trade money for time. You get monitoring in an afternoon, automatic updates, and support when things break, but the meter runs forever and your telemetry lives on someone else's infrastructure. The right answer depends on whether your scarcest resource is budget or engineering hours.
Frequently asked questions
What is the best server monitoring software?
For cloud-native teams, Datadog is the leading choice. For budget-conscious teams, Site24x7 or the free tiers of New Relic work well. For open-source fans, Zabbix and Checkmk are the strongest options. Traditional Windows IT shops usually land on PRTG or SolarWinds.
Is there free server monitoring software?
Yes. Zabbix, Checkmk Raw, and Nagios Core are fully free and open source. PRTG includes 100 sensors free, New Relic gives 100 GB of data ingest per month free, and Datadog offers a 14-day trial. Free options are genuinely capable, not just demos.
How much does server monitoring cost?
It ranges from free (open source) to around $9 per month for Site24x7, $15 per host per month for Datadog, $1,500 per year for SolarWinds SAM, and $1,995 for Nagios XI. Usage-based SaaS pricing grows with your estate, so model the cost at your actual server count.
What is the difference between server monitoring and APM?
Server monitoring tracks the health of the machine itself: CPU, memory, disk, and services. Application performance monitoring (APM) tracks how your software behaves: response times, errors, and transactions. Most tools on this list do both, but their strengths differ.
Do I need an agent on every server?
Most platforms use lightweight agents for deep metrics, though Zabbix, PRTG, and Checkmk also support agentless monitoring via SNMP and WMI. SaaS tools like Datadog and New Relic require their agents. Agentless is simpler to deploy; agents give richer data.
How do I avoid alert fatigue?
Start with alerts only for conditions that need human action, use anomaly detection where available, and route warnings to dashboards rather than phones. Every tool here supports alert tiers and maintenance windows; the discipline matters more than the platform.
Sources we checked (11)
- https://datadoghq.com/
- https://newrelic.com/
- https://www.zabbix.com/
- https://nagios.com/
- https://paessler.com/
- https://solarwinds.com/
- https://site24x7.com/
- https://checkmk.com/
- https://www.scmgalaxy.com/tutorials/top-10-monitoring-tools-in-2025-features-pros-cons-comparison/
- https://www.dotcom-monitor.com/blog/best-network-monitoring-software/
- https://github.com/ishandutta2007/awesome-monitoring/blob/HEAD/README.md
Is your product missing or out of date?
We review this list regularly. Vendors can request a listing, send updated pricing or ask about featured placement.

Shihab Mia · Founder, Rankite
Shihab has spent more than a decade helping SaaS and e-commerce brands grow through search. He writes Rankite's software buying guides from pricing pages, documentation and public user reviews. More about Shihab.