How we make this list: we compare pricing pages, product documentation and public user reviews. Rankite is independent; if a vendor ever pays for a featured spot, that listing is clearly labeled Partner.
Key takeaways
- Sisense and Looker lead for product teams embedding serious analytics, with Sisense's API-first design and Looker's governed semantic layer.
- Metabase (free open source; Cloud from $85/month) is the value pick for teams that want embedded dashboards without enterprise contracts.
- Explo and Luzmo are purpose-built for embedding, with faster time-to-customer-facing dashboards than general BI tools.
- Tableau and Qlik bring brand recognition and depth, but embedding is a feature rather than the core design.
Quick comparison
| Tool | Best for | Starting price | Free plan |
|---|
 Sisense Sisense | product teams building analytics into apps | See website (custom quote) | Free trial |
 Looker Looker | consistent metrics across embedded and internal use | See website (custom quote) | Free trial |
 Tableau Tableau | recognizable, polished embedded visualizations | See website | Free trial |
 Qlik Qlik | associative exploration in embedded apps | See website | Free trial |
 Metabase Metabase | affordable embedded dashboards, open source | Free (open source); Cloud from $85/month | Yes |
 Explo Explo | shipping customer dashboards in days | See website | Free trial |
 Luzmo Luzmo | lightweight embedded charts and dashboards | Free tier; paid plans (see website) | Yes |
 Reveal Reveal | .NET and web apps needing native embedded BI | See website | Free trial |
Is your product missing or out of date?
We review this list regularly. Vendors can request a listing, send updated pricing or ask about featured placement.
Starting priceSee website (custom quote)
Free planFree trial
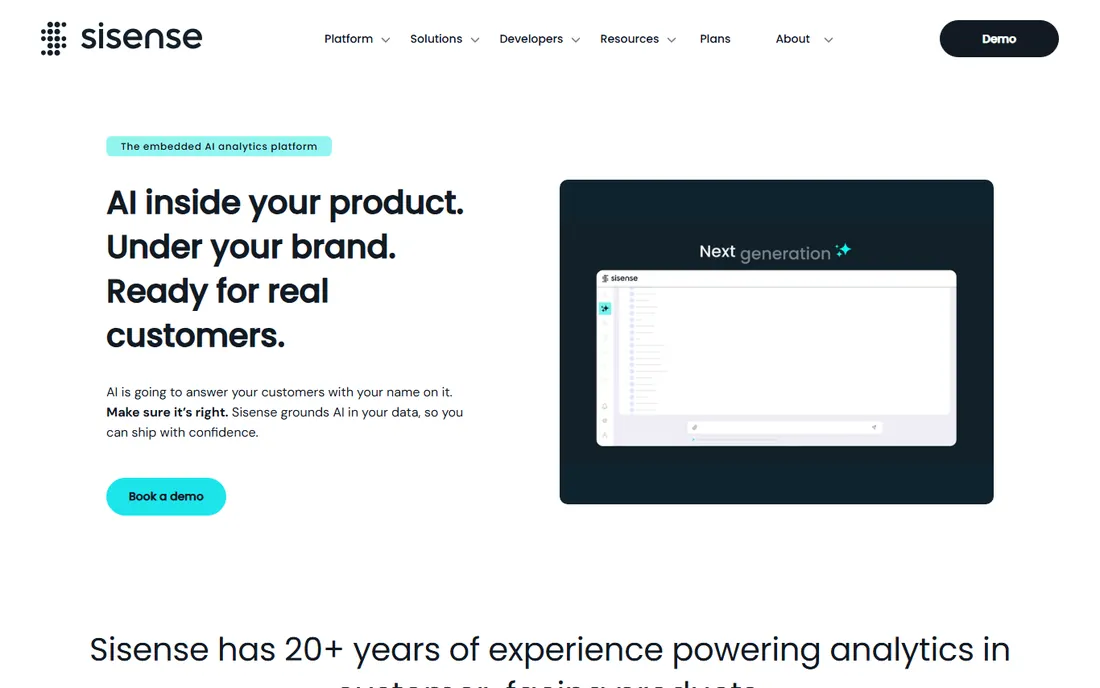
Sisense was built for embedding from the start: APIs, SDKs and white-labeling that let product teams put analytics inside their applications rather than linking out to a separate BI tool. It handles large, complex datasets well, and the customization depth suits products where analytics is a differentiator.
Pricing is custom and implementation takes real engineering. Small teams may find it heavy. For SaaS companies whose customers expect powerful in-product analytics, the investment pays off in retention.
What we like- API-first architecture
- Handles large data volumes
- Flexible embedding options
Watch out for- Quote-based pricing
- Implementation needs technical resources
#2
Looker
Best for: consistent metrics across embedded and internal use
Visit looker.com
Starting priceSee website (custom quote)
Free planFree trial
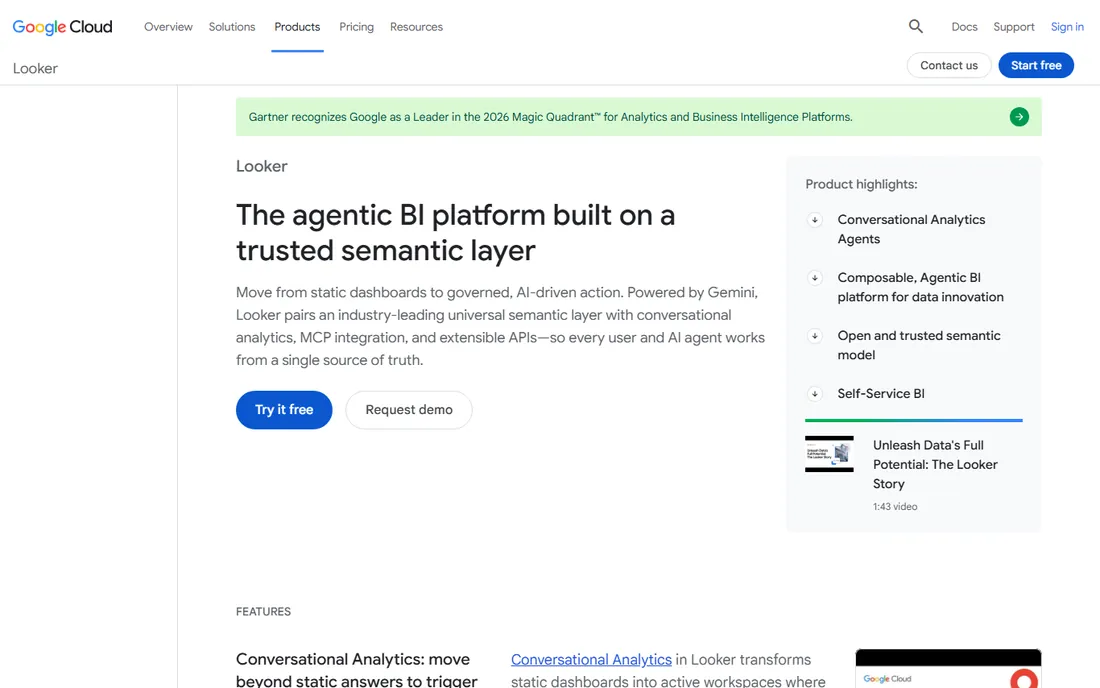
Looker's superpower is LookML: define each metric once, and every embedded dashboard, report and API consumer shows the same number. For companies where "whose dashboard is right?" is a recurring argument, that consistency is worth the implementation effort. Google Cloud ownership deepens the BigQuery integration.
The LookML learning curve is real, and pricing is custom. Teams without data modeling resources struggle. But organizations standardizing metrics across products and internal BI get a single source of truth that embedding-only tools cannot provide.
What we like- LookML semantic layer guarantees consistent definitions
- Strong Google Cloud integration
- Trusted governance
Watch out for- Custom pricing
- LookML learning curve
Starting priceSee website
Free planFree trial
Tableau's visualizations remain the industry benchmark, and embedding them gives your product instant credibility. The talent pool is enormous: finding developers who know Tableau is easy. Salesforce ownership brings enterprise integration depth.
Embedding licenses and architecture feel bolted onto a desktop-first product, and costs scale steeply with viewers. Purpose-built embed tools deploy faster. Choose Tableau when visualization quality and brand recognition outweigh pure embedding efficiency.
What we like- Best-in-class visualization
- Huge talent pool
- Strong community resources
Watch out for- Embedding licensing complexity
- Not designed embedding-first
#4
Qlik
Best for: associative exploration in embedded apps
Visit qlik.com
Starting priceSee website
Free planFree trial
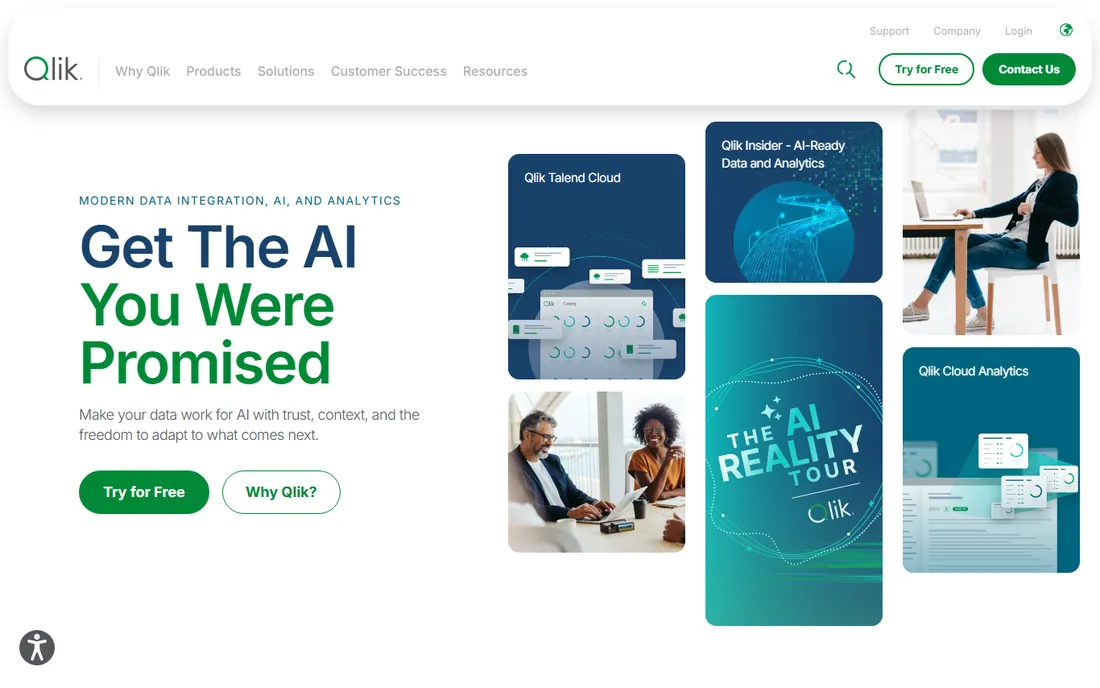
Qlik's associative engine lets users explore data freely, with every selection instantly recalculating all related charts. Embedded in customer-facing products, that exploratory power differentiates. The data integration capabilities handle messy sources well.
The interface shows its age next to newer tools, and pricing requires negotiation. Companies with complex data relationships that benefit from associative exploration get unique value. For straightforward dashboards, simpler tools suffice.
What we like- Associative engine reveals hidden relationships
- Strong data integration
- Enterprise-proven
Watch out for- Quote-based pricing
- Interface less modern than rivals
Starting priceFree (open source); Cloud from $85/month
Free planYes
Metabase is the open-source answer: self-host free, embed dashboards with a clean interface, and upgrade to Cloud from $85 a month when you want managed hosting. Non-technical users build questions without SQL, which speeds adoption.
It will not match Sisense or Looker on advanced analytics or governance. High-concurrency embedded deployments need tuning. For startups and mid-size companies that want real embedded analytics without enterprise sales cycles, it is the rational choice.
What we like- Genuinely free self-hosted option
- Easy to learn
- Clean embedding
Watch out for- Less powerful than enterprise tools
- Scaling needs care
Starting priceSee website
Free planFree trial
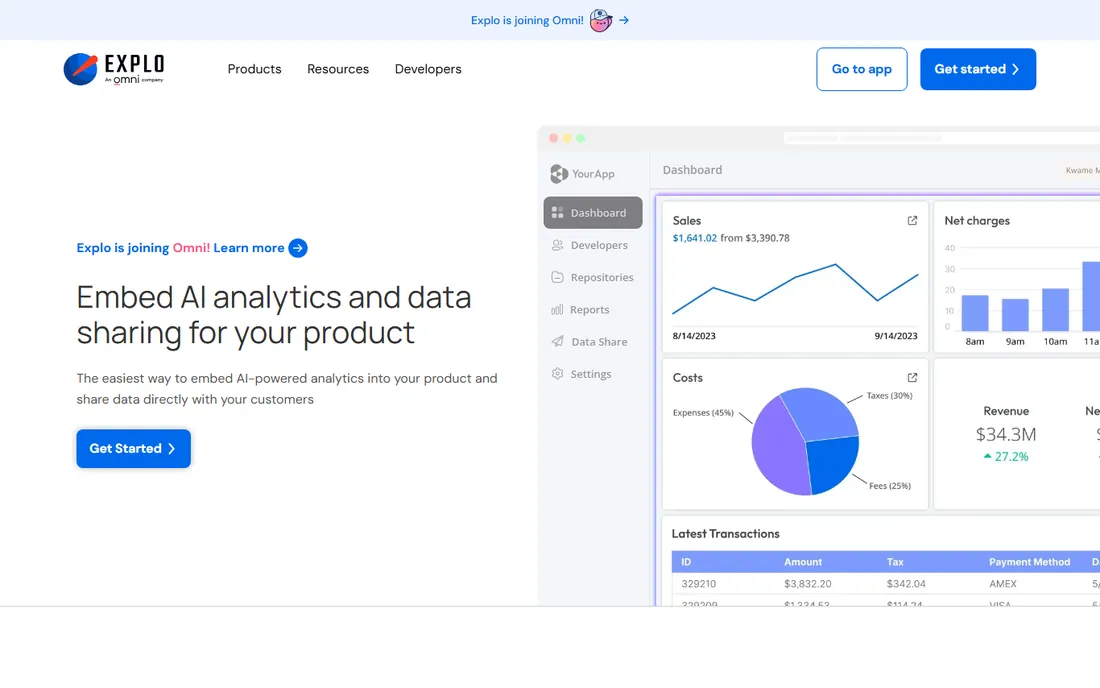
Explo exists for one job: customer-facing dashboards inside your product. No BI baggage, no desktop client, just embeddable analytics with a developer experience designed for the task. Implementation measured in days, not quarters, is the selling point.
The tradeoff is breadth: internal BI, complex data modeling and advanced governance are thinner than general platforms. If embedded dashboards are the entire requirement, that focus is a strength. Pricing requires a conversation.
What we like- Built specifically for embedding
- Fast implementation
- Clean developer experience
Watch out for- Narrower feature set than general BI
- Pricing not published
#7
Luzmo
Best for: lightweight embedded charts and dashboards
Visit luzmo.com
Starting priceFree tier; paid plans (see website)
Free planYes
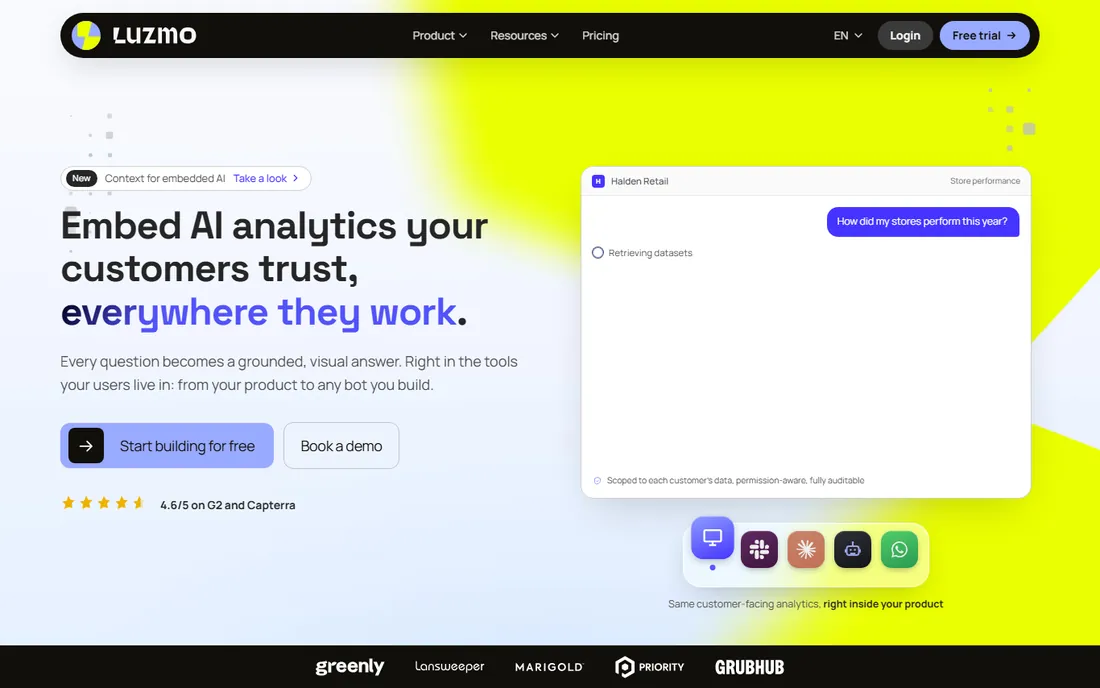
Luzmo (formerly Cumul.io) targets SaaS startups that need embedded charts without enterprise weight. The free tier is genuinely useful, integration is straightforward, and the pricing scales with usage rather than seat counts.
Complex analytical workloads outgrow it. The ecosystem and community are smaller than the giants. For early-stage products adding their first customer-facing dashboards, the low friction and free entry are compelling.
What we like- Generous free tier
- Simple integration
- Good for SaaS startups
Watch out for- Less depth for complex analytics
- Smaller ecosystem
Starting priceSee website
Free planFree trial
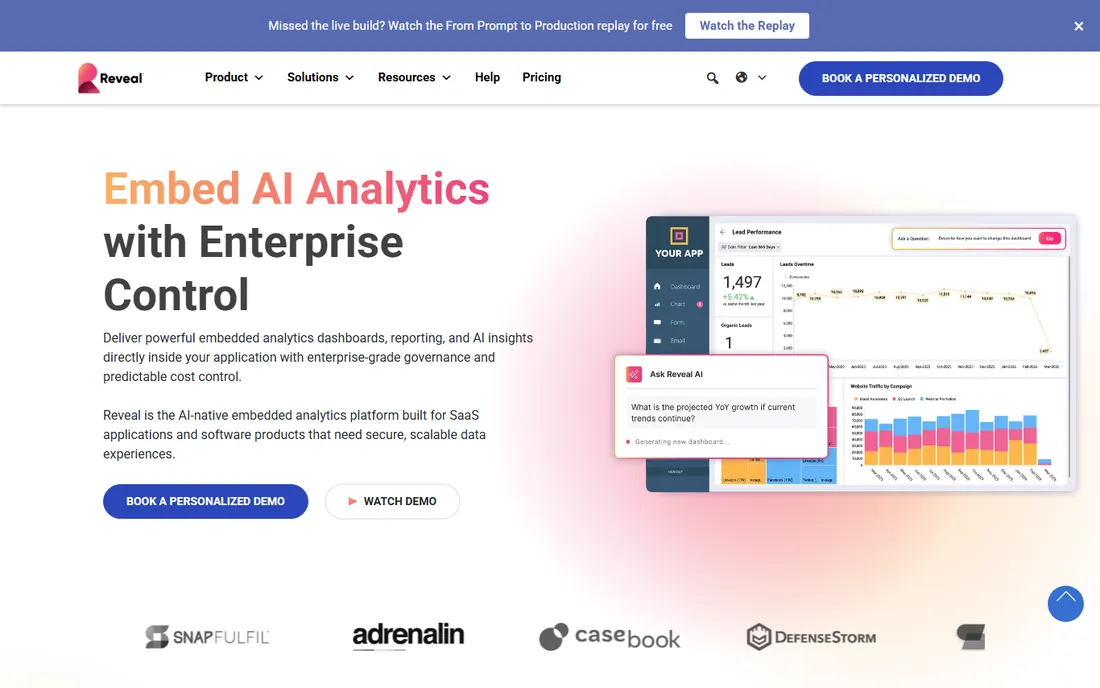
Reveal embeds as a native SDK rather than an iframe: drop it into .NET, JavaScript, or mobile apps and get full BI without a separate server. That architecture suits ISVs shipping desktop or mobile products where web-based embedding feels wrong.
Brand recognition trails the big names, which matters for some enterprise buyers. Pricing is not published. Development teams building native applications get an embedding model the web-first tools cannot match.
What we like- Native SDKs for major platforms
- No server needed
- White-label friendly
Watch out for- Less known than giants
- Pricing not published
How we chose
We compared current vendor documentation, pricing pages and embedding capabilities, cross-checked against developer feedback and 2026 embedded BI comparisons. Every tool listed is actively maintained with a live homepage as of October 2026. We weighted embedding-specific features (APIs, white-labeling, SDKs, multi-tenancy) over general BI strength. Prices are the lowest published tier from each vendor's own pricing page; quote-based vendors are marked accordingly.
What to check before you sign
Start with the embedding architecture. Iframes are simplest but limit customization; JavaScript SDKs and native components integrate deeper. Match the architecture to your product: a web SaaS can live with iframes, while native desktop or mobile apps need Reveal-style SDKs.
Then check multi-tenancy and security. Each customer must see only their data, enforced at the data layer, not just hidden in the UI. Row-level security, SSO integration and tenant isolation are non-negotiable for customer-facing analytics. Ask how tenant provisioning works at scale: onboarding your hundredth customer should not require manual dashboard setup.
Finally, model the pricing against your growth. Per-viewer, per-dashboard and usage-based models behave very differently as your customer base scales. A model cheap at ten customers can be punishing at a thousand. Get the pricing formula in writing and project it three years out.
Pricing models decoded
Embedded analytics pricing is deliberately confusing, so decode it before comparing. Per-viewer pricing charges for every end user who sees a dashboard: cheap when a few admins view reports, punishing when you embed for thousands of customers. Some vendors count monthly active viewers, others count named users, and the difference matters enormously at scale.
Usage-based pricing (per dashboard view, per query, per row scanned) aligns cost with value but creates unpredictable bills. A customer's heavy usage month becomes your invoice spike. Ask for usage caps and alerting. Flat platform fees are simplest: pay for the software, embed for unlimited viewers. Metabase's open-source self-hosted option is the extreme version of this: free software, you handle the servers.
The right model depends on your customer count and usage patterns. Under a hundred viewers, per-viewer pricing is usually cheapest. Past a thousand, flat or usage-based wins. Always get the formula in writing and model it against your three-year growth plan, because renegotiating mid-contract is painful.
Build vs buy for product analytics
The temptation to build custom dashboards is strong, and for simple charts it works. But the costs compound: chart libraries, data pipelines, caching, access control, export features, mobile responsiveness and the endless feature requests from customers who have seen real BI tools.
Purpose-built embedded platforms amortize that work across thousands of customers. The break-even point usually arrives sooner than engineering teams estimate, often within the first year of serious analytics requests. Build the visualizations that differentiate your product; buy the platform that delivers them reliably.
Frequently asked questions
What is embedded analytics?
Analytics built into your software product so customers see dashboards and reports inside your app, not in a separate BI tool. It turns your data into a product feature that improves retention and justifies pricing.
How is embedded analytics priced?
Models vary: per end-viewer, per dashboard, usage-based, or flat platform fees. Metabase Cloud starts at $85/month; enterprise tools are custom. Project costs against your customer growth, since per-viewer models scale steeply.
Can I white-label embedded dashboards?
Yes, all tools on this list support white-labeling to varying degrees: your branding, your domain, no vendor logos. The depth of customization (CSS control, custom themes) differs, so verify against your design requirements.
Do I need a data warehouse first?
Not necessarily, but it helps. Tools can query your application database directly for simple cases. As data grows, a warehouse (BigQuery, Snowflake, Postgres) with a semantic layer gives better performance and consistency.
Iframe vs SDK embedding: which is better?
Iframes deploy fastest and isolate the analytics code. SDKs and native components integrate deeper with your app's design and navigation. Web products usually start with iframes; native apps need SDKs.
How long does implementation take?
Purpose-built tools (Explo, Luzmo, Metabase) can ship basic dashboards in days to weeks. Enterprise platforms (Sisense, Looker, Tableau) typically take one to three months including data modeling and governance setup.
Can embedded dashboards work on mobile?
Yes, but verify. Responsive design varies: some platforms render beautifully on phones, others assume desktop. If your customers use your product on mobile, test the embedded dashboards on real devices during the trial, not just in the vendor's demo.
What happens to my dashboards if I switch vendors?
You rebuild them. Dashboard definitions, data models and customizations rarely migrate between platforms. This lock-in is real, which is why the evaluation matters. Prefer vendors with exportable definitions and standard SQL access to reduce the switching cost.
Should embedded analytics be a profit center?
It can be. Many SaaS companies package advanced analytics as a premium tier or add-on, turning the embedding cost into revenue. Price the analytics tier against the value customers get from the insights, not against your software cost. Even a modest uplift across your customer base usually covers the platform many times over. Track which customers use the analytics features and correlate with retention: the data usually justifies expanding the analytics offering further.
Sources we checked (8)
- https://www.sisense.com
- https://looker.com
- https://www.tableau.com
- https://www.qlik.com
- https://www.metabase.com
- https://www.explo.co
- https://www.luzmo.com
- https://www.revealbi.io
Is your product missing or out of date?
We review this list regularly. Vendors can request a listing, send updated pricing or ask about featured placement.

Shihab Mia · Founder, Rankite
Shihab has spent more than a decade helping SaaS and e-commerce brands grow through search. He writes Rankite's software buying guides from pricing pages, documentation and public user reviews. More about Shihab.