How we make this list: we compare pricing pages, product documentation and public user reviews. Rankite is independent; if a vendor ever pays for a featured spot, that listing is clearly labeled Partner.
Key takeaways
- Firebase Analytics (free, unlimited events) is the default starting point; most apps should run it before paying for anything else.
- Mixpanel (free to 1M events/month) and Amplitude (free Starter; Plus from $49/month billed annually) answer in-app behavior questions; pick one, not both.
- AppsFlyer (free Zero plan; Growth $0.07/conversion) and Singular (free plan; Growth $0.05/conversion) handle attribution: which ads drove the installs.
- UXCam (from $20/month) and Smartlook (from $19/month) show session replays and heatmaps: why users tap, rage-quit and drop off.
- PostHog (free to 1M events) is the engineering-led all-in-one: analytics, feature flags, experiments and replay under one bill.
Quick comparison
| Tool | Best for | Starting price | Free plan |
|---|
 Firebase Analytics Firebase Analytics | Every app that needs a free analytics foundation | Free | Yes |
 Mixpanel Mixpanel | Product teams wanting fast, self-serve answers | Free to 1M events/month; Growth from $0.28 per 1,000 events above that | Yes |
 Amplitude Amplitude | Teams wanting behavioral analytics with predictive depth | Free Starter; $49/month (Plus, billed annually) | Yes |
 AppsFlyer AppsFlyer | Marketers running paid user acquisition | Free Zero plan; $0.07/conversion (Growth) | Yes |
 Adjust Adjust | Marketers prioritizing fraud prevention and measurement accuracy | See website | No (demo only) |
 Singular Singular | Teams wanting attribution plus unified marketing cost data | Free plan; $0.05/conversion (Growth) | Yes |
 UXCam UXCam | UX teams diagnosing exactly where users struggle | Free plan; from $20/month | Yes |
 Smartlook Smartlook | Product teams wanting visual behavior analytics without complexity | Free plan; from $19/month | Yes |
 PostHog PostHog | Engineering-led teams wanting analytics plus flags, experiments and replay in one | Free to 1M events/month; then usage-based from $0.00005/event | Yes |
 Countly Countly | Teams that need analytics on their own infrastructure | Free (self-hosted Community); Enterprise custom | Yes (self-hosted) |
Is your product missing or out of date?
We review this list regularly. Vendors can request a listing, send updated pricing or ask about featured placement.
The best mobile app analytics
Mobile analytics splits into three jobs that need different tools. Product analytics measures what users do inside the app: funnels, retention, feature adoption. Attribution measures what happens outside it: which ad, campaign or channel drove the install. Visual analytics shows the taps, swipes and rage-quits behind the numbers. Most serious apps run one tool from each bucket. The ten below cover all three.
Starting priceFree
Free planYes
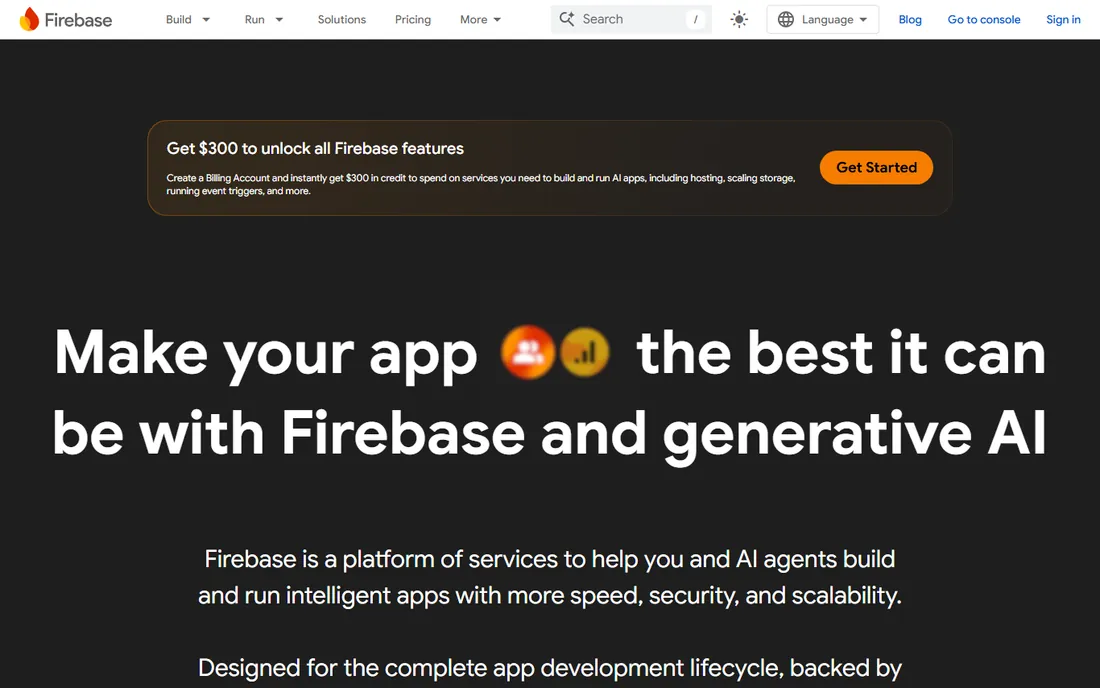
Firebase Analytics is where most apps should start, because it costs nothing and covers the essentials: event tracking, audiences, funnels, retention basics and real-time dashboards. If your team already uses Crashlytics or Remote Config, the integration is native and the combined view of stability plus behavior is genuinely useful.
The ceiling is real. Product teams that need deep cohort analysis, path analysis or predictive insights outgrow Firebase and add Mixpanel or Amplitude alongside it. Also note the trade: free here means Google's data terms, which deserve a read in regulated industries. As a free foundation under a paid product-analytics layer, Firebase is the standard stack.
What we like- Completely free with no event limits
- Deep integration with Crashlytics, Remote Config and the Google stack
- Audiences and funnels included
Watch out for- Weaker cohort and retention analysis than Mixpanel or Amplitude
- Google data-sharing terms need legal review
- Reporting is less flexible for product teams
Starting priceFree to 1M events/month; Growth from $0.28 per 1,000 events above that
Free planYes
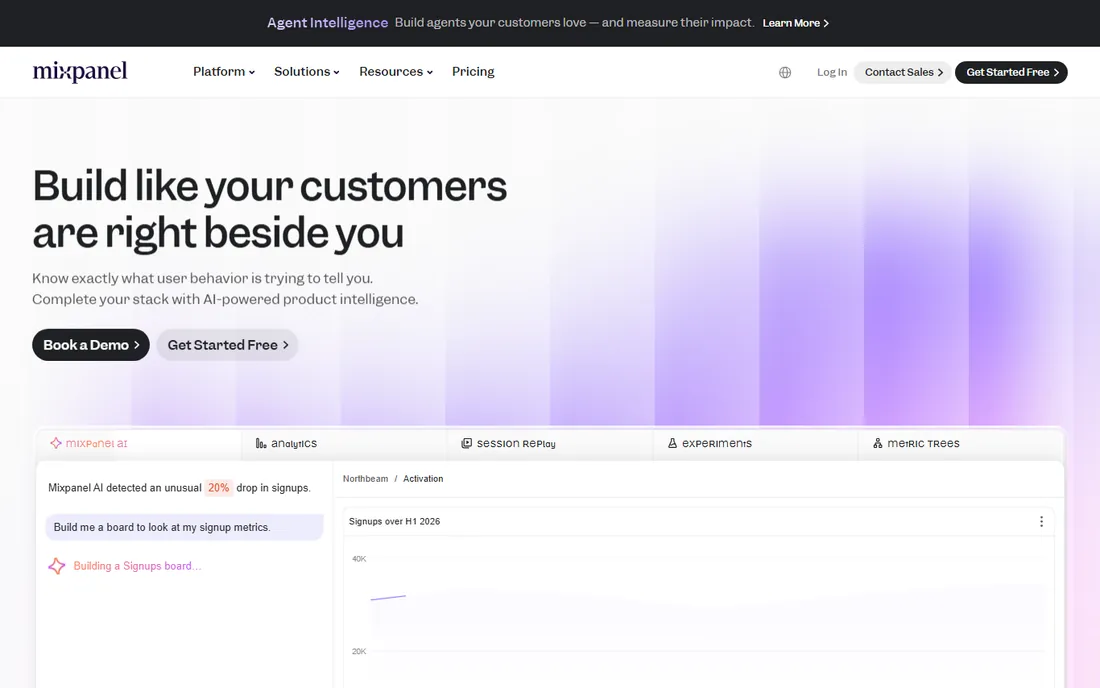
Mixpanel's pitch is answers without a query language: product managers build funnels, retention curves and user flows themselves, in minutes. The free plan covers 1M events a month, 10K session replays and unlimited seats with no card, which is enough for most early-stage apps to run entirely free.
The honest catch is scale economics. Above the free tier, Growth pricing runs about $0.28 per 1,000 events, making it the priciest per-event option among the big three at high volumes. Teams with event-heavy apps should model the cost at their real volume, not at the free tier. For PM-led teams that value speed of insight, it is still the easiest tool to love.
What we like- The most generous free tier in product analytics
- Funnels, retention and flows build in minutes without SQL
- Session replay included from the free plan
Watch out for- The most expensive per event at scale (roughly $2,520/month at 10M events)
- Group analytics and data pipelines are paid add-ons
- Costs spike with event volume
#3
Amplitude
Best for: Teams wanting behavioral analytics with predictive depth
Visit amplitude.com
Starting priceFree Starter; $49/month (Plus, billed annually)
Free planYes
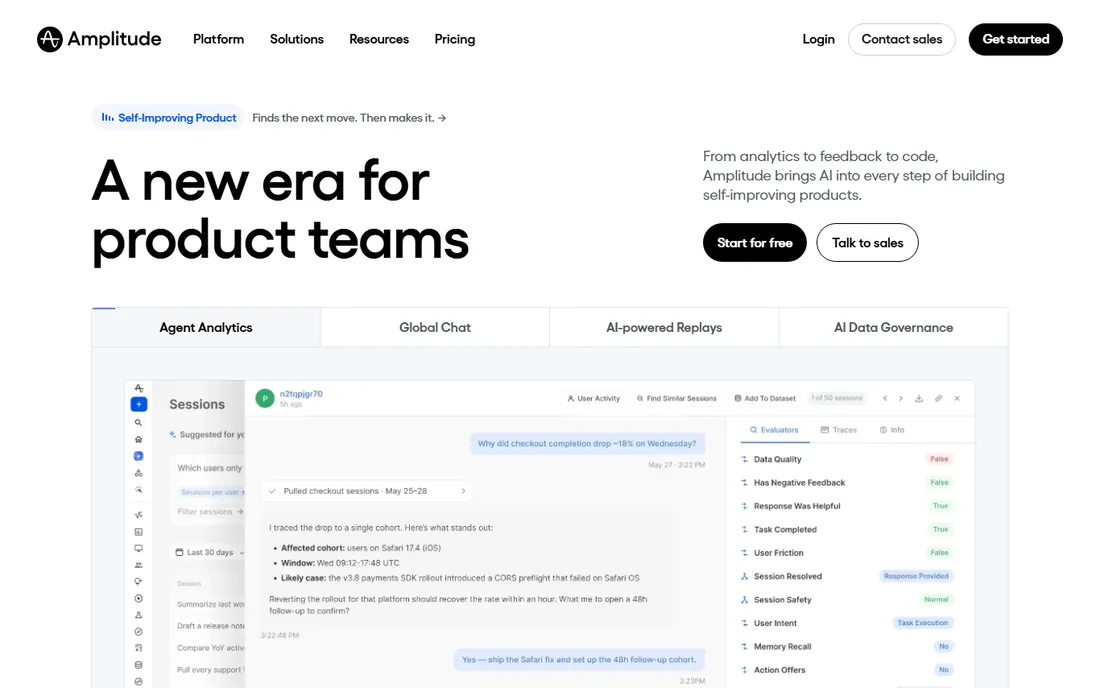
Amplitude is the analyst's choice: deeper behavioral modeling, causal insights, predictive audiences and experimentation built into the platform rather than bolted on. The free Starter plan is generous, covering up to 50K monthly tracked users with session replay and feature flags, and Plus at $49 a month billed annually extends to 300K MTUs.
The pricing cliff is the story. Past Plus, everything is negotiated, and buyer data shows a wide range of contract values at scale. Amplitude rewards teams that invest in event taxonomy and governance; teams that skip that work pay enterprise prices for a tool few people open. For data-mature product organizations, it is the deepest platform here.
What we like- Free Starter covers up to 50K MTUs with experimentation included
- Behavioral cohorts and predictive audiences on paid tiers
- Strong data governance
Watch out for- Growth and Enterprise are custom-quoted with no self-serve path
- Real contracts run $24K to $379K a year at scale
- Setup and taxonomy work is heavier than Mixpanel
Starting priceFree Zero plan; $0.07/conversion (Growth)
Free planYes
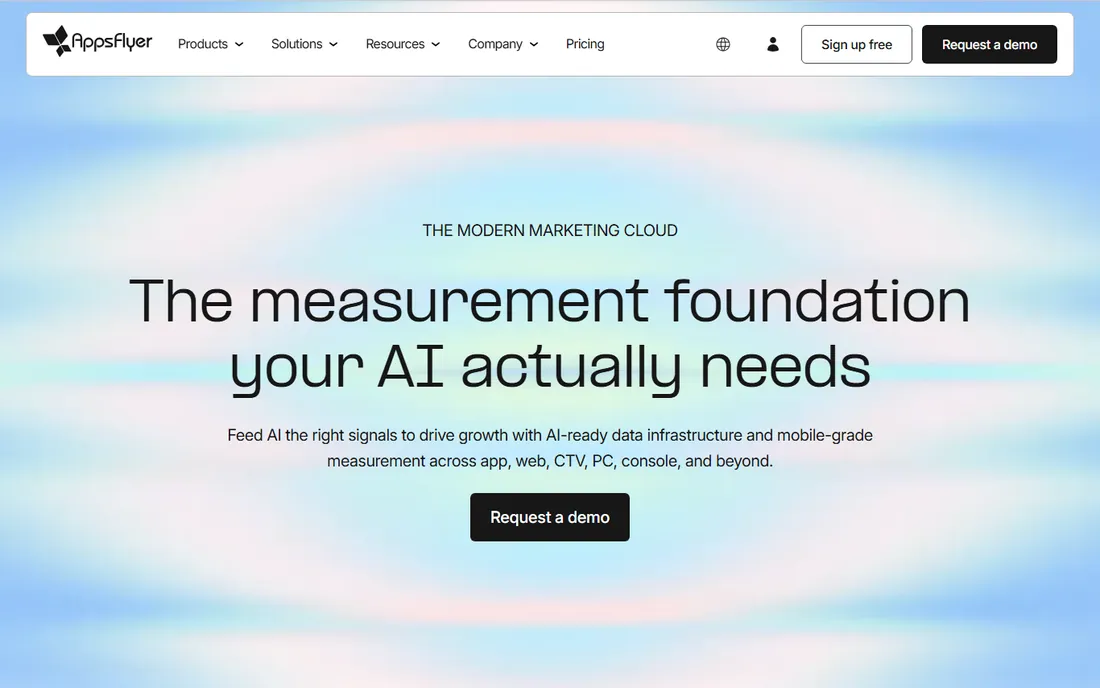
AppsFlyer answers the marketer's question: which channel, campaign and creative drove each install, and was the traffic real? The Zero plan is genuinely free with a first-year welcome package of about 12,000 conversions, and Growth at $0.07 per conversion is published openly, which is rare in this category. Protect360 fraud protection and deep linking round out the platform.
Two caveats. Conversion-based billing means a viral moment or seasonal spike raises the bill without warning, so budget with headroom. And several premium modules carry unpublished prices, so the full stack costs more than the headline rate. If you spend real money on paid acquisition, an MMP like AppsFlyer is close to mandatory. If growth is organic, Firebase plus product analytics is enough.
What we like- The industry-standard mobile measurement partner
- Transparent per-conversion pricing
- Protect360 fraud protection and deep linking included
Watch out for- Per-conversion billing punishes viral spikes
- Premium modules like creative optimization are not publicly priced
- Overkill for organic-only apps
#5
Adjust
Best for: Marketers prioritizing fraud prevention and measurement accuracy
Visit adjust.com
Starting priceSee website
Free planNo (demo only)
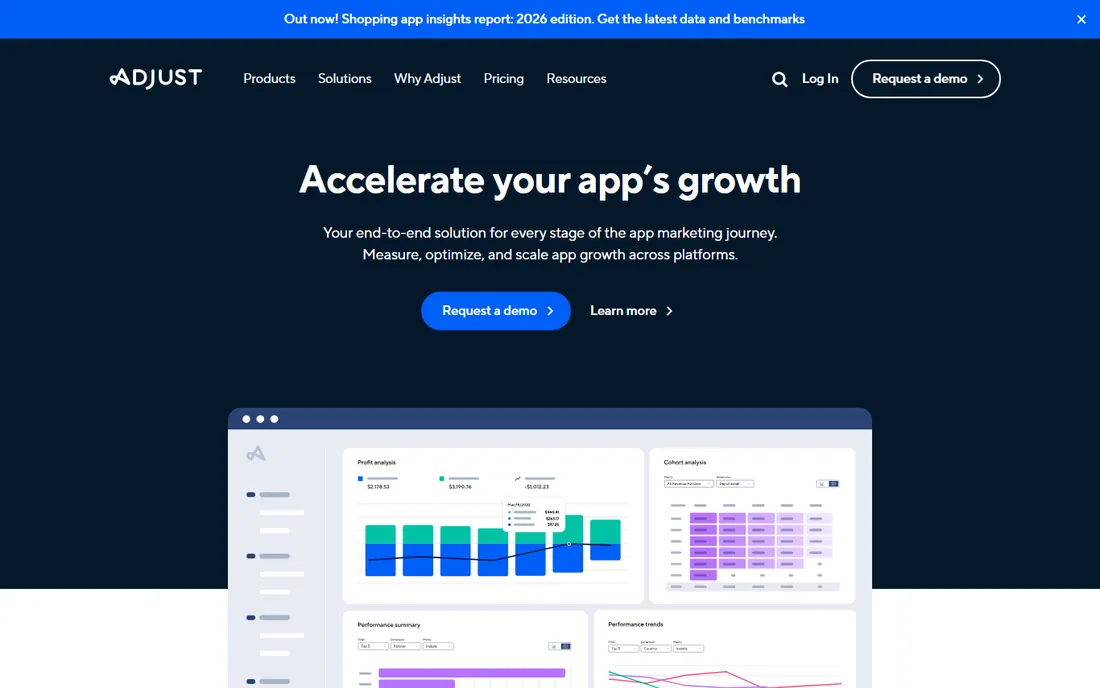
Adjust competes with AppsFlyer head-on as a mobile measurement partner, with its reputation built on fraud prevention and measurement accuracy. Marketers who have been burned by fake installs tend to land here. The platform handles attribution, deep linking, audience building and aggregated SKAdNetwork measurement for the post-ATT world.
The buying experience is the downside: pricing is entirely custom-quoted, there is no free tier, and you negotiate blind against AppsFlyer's published rates. Use that published competition as your bargaining chip. For teams where fraud is the primary concern rather than the broadest feature set, Adjust is the specialist pick.
What we like- Fraud prevention is best-in-class
- Strong SKAdNetwork and privacy-centric measurement
- Clean, marketer-friendly reporting
Watch out for- Custom-quoted pricing with no public rates
- No free tier
- Smaller ecosystem of add-on modules than AppsFlyer
#6
Singular
Best for: Teams wanting attribution plus unified marketing cost data
Visit singular.net
Starting priceFree plan; $0.05/conversion (Growth)
Free planYes

Singular's pitch is simple: attribution plus the marketing cost data, unified. While other MMPs measure installs, Singular also aggregates what you spent across every network, giving true ROI in one view. Growth at $0.05 per conversion undercuts AppsFlyer, and the free plan includes fraud prevention for up to 15,000 paid conversions, which is generous.
The trade is ecosystem. Fewer teams use Singular, so community knowledge, agency familiarity and third-party integrations are thinner. For performance marketing teams that live in ROI spreadsheets, the unified cost reporting is a genuine advantage worth the smaller ecosystem.
What we like- Lower per-conversion price than AppsFlyer ($0.05 vs $0.07)
- Cost aggregation unifies spend reporting across networks
- Free plan includes fraud prevention
Watch out for- Smaller market share means fewer peer references
- Brand recognition lags the big two MMPs
- Some advanced modules trail AppsFlyer
#7
UXCam
Best for: UX teams diagnosing exactly where users struggle
Visit uxcam.com
Starting priceFree plan; from $20/month
Free planYes
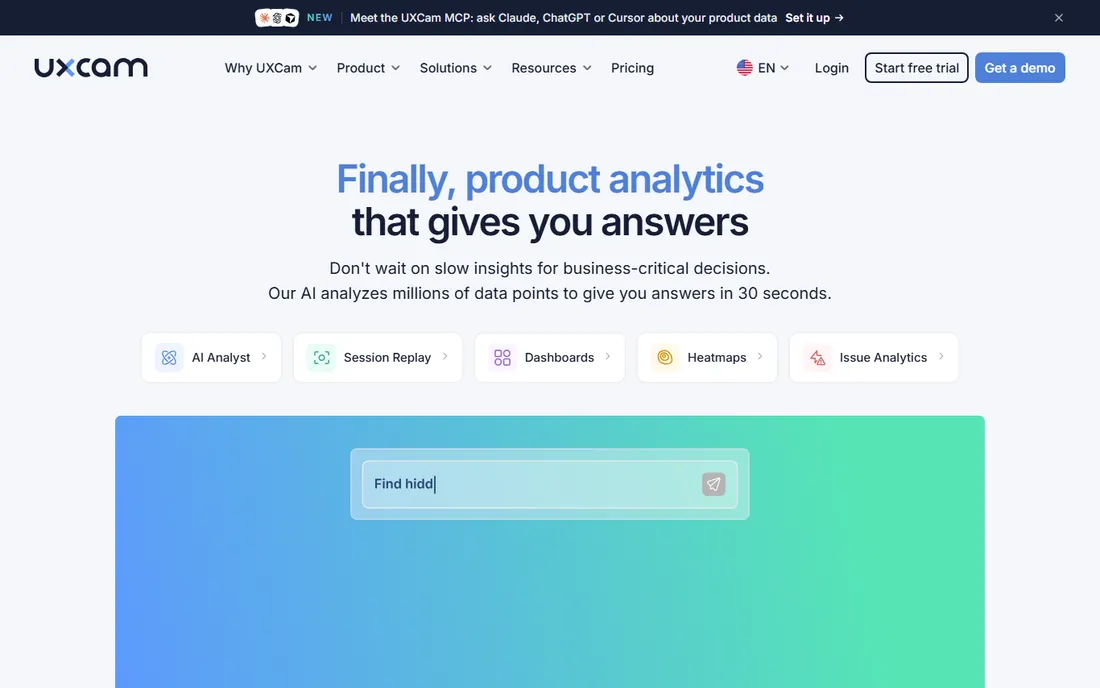
UXCam answers "why" with video. When a funnel shows a 40% drop at checkout, UXCam shows the session replays of users rage-tapping the payment button. Gesture-level capture built for mobile, heatmaps, and funnel-to-replay linking make it the best dedicated mobile UX analysis tool here, with a free plan to start and paid plans from around $20 a month.
It does not replace product analytics. You still need Mixpanel, Amplitude or Firebase for the quantitative picture; UXCam provides the qualitative layer on top. For product and UX teams that iterate on screens weekly, the combination is the highest-ROI stack in mobile analytics.
What we like- Purpose-built mobile session replay with gesture capture (swipes, pinches, rage taps)
- Heatmaps show where attention goes
- Funnels link to the replays behind drop-offs
Watch out for- It is a qualitative tool, not a full product analytics platform
- Smaller company than the giants
- Advanced analysis needs pairing with Mixpanel or Amplitude
#8
Smartlook
Best for: Product teams wanting visual behavior analytics without complexity
Visit smartlook.com
Starting priceFree plan; from $19/month
Free planYes

Smartlook records sessions and builds heatmaps with near-zero instrumentation effort, and because capture is always on, you can investigate a problem you did not know to instrument for. Starting from around $19 a month with a free plan, it is the cheapest way to add visual analytics to an app.
It sits between UXCam and the product analytics tools: less mobile-specialized than the former, less analytical than the latter. For small product teams that want to see what users do without a big implementation project, that middle ground is exactly right. Note the ownership: Cisco acquired Smartlook, which brings enterprise credibility and the usual big-company roadmap questions.
What we like- Session recordings and heatmaps with minimal setup
- Always-on capture means you can analyze retroactively
- Affordable entry price
Watch out for- Less mobile-specialized than UXCam
- Analytics depth is lighter than dedicated product tools
- Owned by Cisco, which may concern some buyers on roadmap
#9
PostHog
Best for: Engineering-led teams wanting analytics plus flags, experiments and replay in one
Visit posthog.com
Starting priceFree to 1M events/month; then usage-based from $0.00005/event
Free planYes
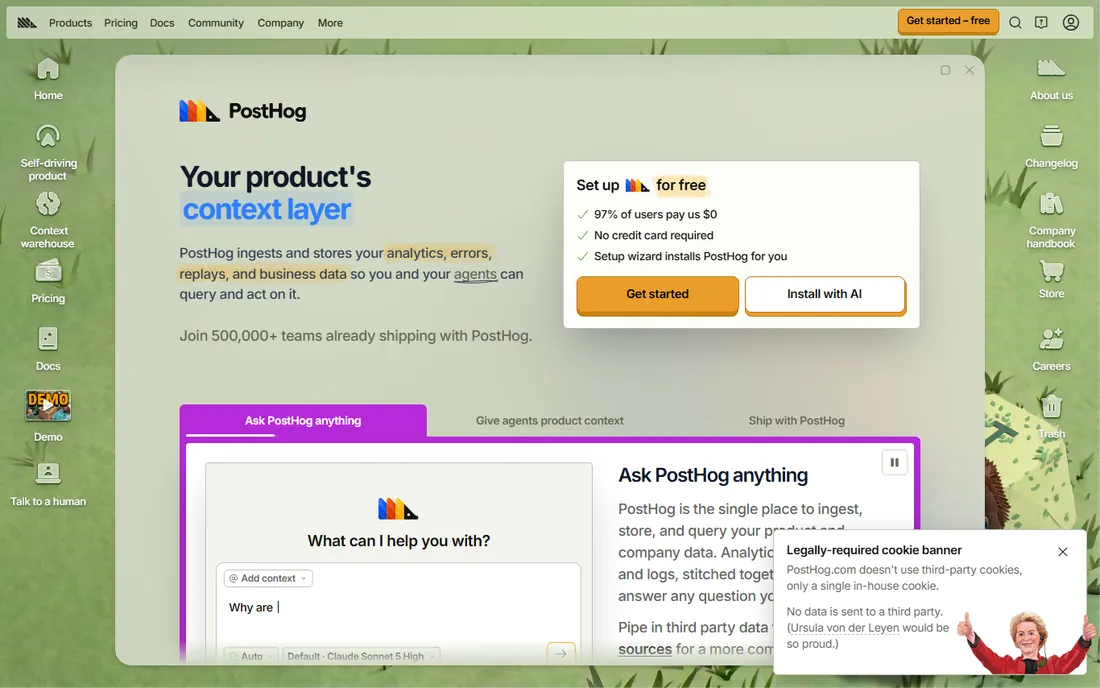
PostHog is the developer's answer to the analytics stack: instead of five tools with five bills, one open-source platform covers product analytics, session replay, feature flags, A/B testing, surveys and error tracking. The free tier includes 1M events and thousands of replays monthly, and usage-based pricing beyond that is transparent down to the per-event rate.
The meter-everything model cuts both ways: enabling replay, flags and surveys each adds to the bill, so set billing limits per product from day one. For engineering-led teams that would rather run one tool than stitch five together, PostHog is the most complete value in this category, and the self-hosted option solves data-residency concerns outright.
What we like- One platform and one SDK for analytics, session replay, feature flags, experiments and surveys
- Open-source with a self-hosted option
- Generous free tier
Watch out for- Each product is metered separately, so the bill grows as you enable more
- The interface is powerful but less polished than Mixpanel
- Support is community-first on free tiers
#10
Countly
Best for: Teams that need analytics on their own infrastructure
Visit count.ly
Starting priceFree (self-hosted Community); Enterprise custom
Free planYes (self-hosted)
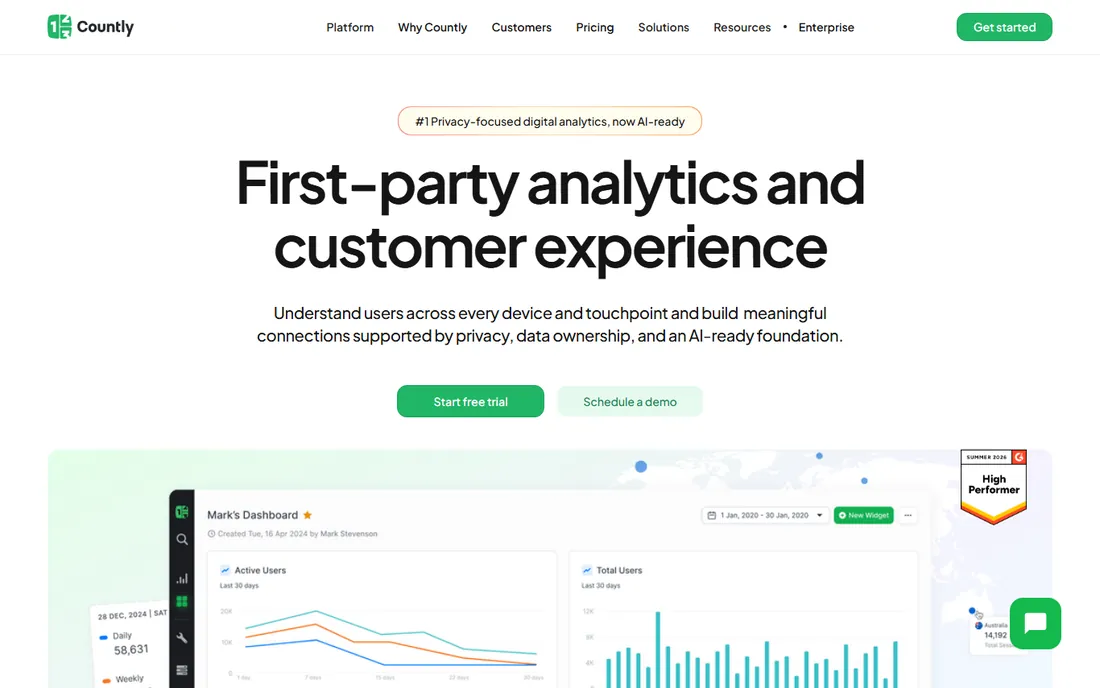
Countly exists for one reason: data ownership. The Community edition is free and open-source for self-hosting, which suits regulated industries, government-adjacent work and companies with strict data-residency requirements. No per-event pricing, no vendor data sharing, your servers, your rules.
The price is operational, not financial. Running Countly well needs DevOps attention, and the free edition drops some advanced features. Most teams should take the cloud tools above and never think about servers. But when legal or compliance says the data cannot leave your infrastructure, Countly is the credible answer.
What we like- Self-hosting means your data never leaves your servers
- Open-source core with no event-metered pricing games
- Full feature set available on Enterprise
Watch out for- Self-hosting is real operational work
- The Community edition lacks some advanced features like funnels
- Smaller ecosystem and community than the leaders
How we chose
We split mobile analytics into its three real jobs, product analytics, attribution and visual behavior analysis, and picked leaders and strong alternatives in each. For every tool we verified current pricing on the vendor's own pricing page or on third-party pages citing vendor pages with 2026 check dates, noting free-tier limits in events, MTUs or conversions since those define the real cost. We weighed public review patterns on G2, Capterra and Reddit, checked SDK maturity and platform support for iOS and Android, and considered privacy posture including ATT, SKAdNetwork and GDPR support. We excluded retired or renamed tools rather than listing legacy names. No vendor paid for placement.
Start free, then pay for the question you actually have
The free tiers in this category are unusually generous: Firebase is unlimited and free, Mixpanel and PostHog each give 1M events a month, Amplitude's Starter covers 50K users, and AppsFlyer's Zero plan covers early attribution. A new app can run a complete analytics stack for nothing. The mistake is paying before knowing which question needs answering.
Upgrade when a specific question goes unanswered. If you cannot explain why activation dropped, you need product analytics depth: Mixpanel or Amplitude. If you cannot tell which ads drive profitable users, you need an MMP: AppsFlyer, Adjust or Singular. If you can see the drop-off but not the cause, you need session replay: UXCam or Smartlook. Each upgrade maps to a question, and each question maps to revenue. Pay for the question, not the platform.
The ATT reality check
Apple's App Tracking Transparency changed this category permanently, and buyers should understand what it did and did not break. ATT restricts tracking users across other companies' apps and websites. It does not stop you from measuring your own app. First-party product analytics, funnels, retention, feature usage, run on your own data and are unaffected by users declining the prompt.
What broke is ad attribution precision. Most users decline tracking, so MMPs now lean on Apple's aggregated, delayed SKAdNetwork data for iOS campaign measurement. This makes attribution directionally useful rather than precise, and it is why the MMPs all emphasize modeled and aggregated measurement now. Practical takeaway: invest in first-party analytics first, since that data is fully yours, and treat attribution as essential but approximate. Tools that never needed cross-app identifiers were never affected at all.
Frequently asked questions
What is the best free mobile app analytics tool?
Firebase Analytics: free, unlimited events, with funnels, audiences and crash reporting built in. For product analytics specifically, Mixpanel's free tier (1M events/month) and PostHog's free tier (1M events plus replays) are the most generous. For attribution, AppsFlyer's Zero plan is free for early-stage apps.
Do I need both product analytics and an MMP?
It depends on your growth model. If you spend on paid user acquisition, yes: product analytics (Mixpanel, Amplitude) tells you what users do, and an MMP (AppsFlyer, Adjust, Singular) tells you which ads brought them. If growth is organic through the app stores or word of mouth, product analytics plus Firebase usually covers it, and an MMP adds little.
How much does mobile app analytics cost?
Most apps start free: Firebase, Mixpanel, PostHog and Amplitude all have generous free tiers. Paid product analytics typically runs $49 to a few hundred dollars a month at moderate scale, rising steeply with event volume. MMPs charge per conversion: $0.05 to $0.07 each, which means meaningful paid-acquisition volume quickly reaches thousands per month. Session replay tools start around $19 to $20 a month.
What is the difference between Mixpanel and Amplitude?
Both do event-based product analytics, but Mixpanel optimizes for self-serve speed: PMs get answers without SQL. Amplitude goes deeper on behavioral modeling, cohorts, predictions and experimentation, with heavier setup and enterprise pricing past the Plus tier. Small, fast-moving teams usually prefer Mixpanel; data-mature organizations with dedicated analysts prefer Amplitude.
How do I choose between AppsFlyer, Adjust and Singular?
All three are credible MMPs. AppsFlyer has the largest market share and the most transparent pricing. Adjust leads on fraud prevention reputation. Singular undercuts on per-conversion price and unifies marketing cost reporting. If fraud is your top worry, lean Adjust; if you want the safe consensus pick, AppsFlyer; if ROI reporting across networks matters most, Singular.
Is session replay worth adding?
Yes, if you iterate on screens. Funnels tell you where users drop off; replays show you why, the confusing button, the broken form, the rage tap. UXCam is the most mobile-specialized, Smartlook the easiest to deploy, and Mixpanel, Amplitude and PostHog all bundle some replay now. For teams that ship app updates regularly, it pays for itself in avoided bad releases.
Sources we checked (14)
- https://firebase.google.com/pricing/
- https://mixpanel.com/pricing/
- https://amplitude.com/pricing/
- https://www.appsflyer.com/pricing/
- https://www.adjust.com/pricing/
- https://www.singular.net/pricing/
- https://uxcam.com/pricing/
- https://www.smartlook.com/pricing/
- https://posthog.com/pricing/
- https://count.ly/pricing/
- https://www.softwareworld.co/mobile-analytics-software/
- https://uxcam.com/blog/mobile-app-tracking-tools/
- https://github.com/posthog/posthog.com/blob/HEAD/contents/blog/best-mobile-app-analytics-tools.mdx
- https://telemetrydeck.com/app-analytics-tools-you-should-know-about/
Is your product missing or out of date?
We review this list regularly. Vendors can request a listing, send updated pricing or ask about featured placement.

Shihab Mia · Founder, Rankite
Shihab has spent more than a decade helping SaaS and e-commerce brands grow through search. He writes Rankite's software buying guides from pricing pages, documentation and public user reviews. More about Shihab.