How we make this list: we compare pricing pages, product documentation and public user reviews. Rankite is independent; if a vendor ever pays for a featured spot, that listing is clearly labeled Partner.
Key takeaways
- Datadog is the safe default for full-stack observability, but every module is metered separately, so budget logs and custom metrics on their own lines.
- New Relic and Grafana Cloud offer the most usable free tiers, making them the lowest-risk way to start.
- Site24x7 covers the most ground per dollar for small IT teams, with all-in-one packs starting at $9 a month.
- Dynatrace earns its premium in complex enterprise estates with automatic topology mapping, while simpler shops will find it heavy.
- Whichever you pick, set log retention and metric cardinality policies on day one, since those two settings drive most surprise bills.
Quick comparison
| Tool | Best for | Starting price | Free plan |
|---|
 Datadog Datadog | Growing engineering teams that want one platform for metrics, traces, and logs | $15/host/month (Infrastructure Pro, billed annually) | Free trial |
 New Relic New Relic | Teams that want predictable, user-based pricing with a real free tier | Free $0; Standard from $10/user/month | Yes |
 Grafana Cloud Grafana Cloud | Teams invested in open-source observability standards | $19/month platform fee plus usage | Yes |
 Dynatrace Dynatrace | Large enterprises with complex, hard-to-map environments | $7/host/month (Foundation) | Free trial |
 Site24x7 Site24x7 | Small IT teams that need broad coverage on a tight budget | $9/month | Free trial (30 days) |
 LogicMonitor LogicMonitor | IT teams managing mixed on-prem and cloud infrastructure | $16/hybrid unit/month (Essentials) | Free trial (15 days) |
 Splunk Observability Cloud Splunk Observability Cloud | Teams that need streaming, real-time analytics and already buy Cisco | $15/host/month (Infrastructure, billed annually) | Free trial |
 Elastic Cloud Elastic Cloud | Log-heavy teams already comfortable with the Elastic Stack | From $16.40/month | Yes |
 AWS CloudWatch AWS CloudWatch | AWS-centric teams that want native integration with zero setup | Pay as you go (free tier included) | Yes |
 SolarWinds Observability SolarWinds Observability | Network-centric teams that want SaaS or self-hosted options | $15.75/node/month (Network and Infrastructure, SaaS) | Free trial |
Is your product missing or out of date?
We review this list regularly. Vendors can request a listing, send updated pricing or ask about featured placement.
The best cloud monitoring software
#1
Datadog
Best for: Growing engineering teams that want one platform for metrics, traces, and logs
Visit datadoghq.com
Starting price$15/host/month (Infrastructure Pro, billed annually)
Free planFree trial
Datadog is the platform most cloud teams end up on, and the reason is boring: it covers infrastructure, APM, logs, synthetics, and RUM in one place with more than a thousand integrations. Once your team is bigger than a handful of engineers, that consolidation starts to matter more than any single feature. The watch-out is cost discipline. Every product is metered separately, so you have to set retention and sampling policies early or the bill grows on its own.
What we like- Huge integration library
- Strong Kubernetes support
- Dashboards your team will actually use
Watch out for- Costs stack up fast across modules
- You need someone watching the meter
#2
New Relic
Best for: Teams that want predictable, user-based pricing with a real free tier
Visit newrelic.com
Starting priceFree $0; Standard from $10/user/month
Free planYes
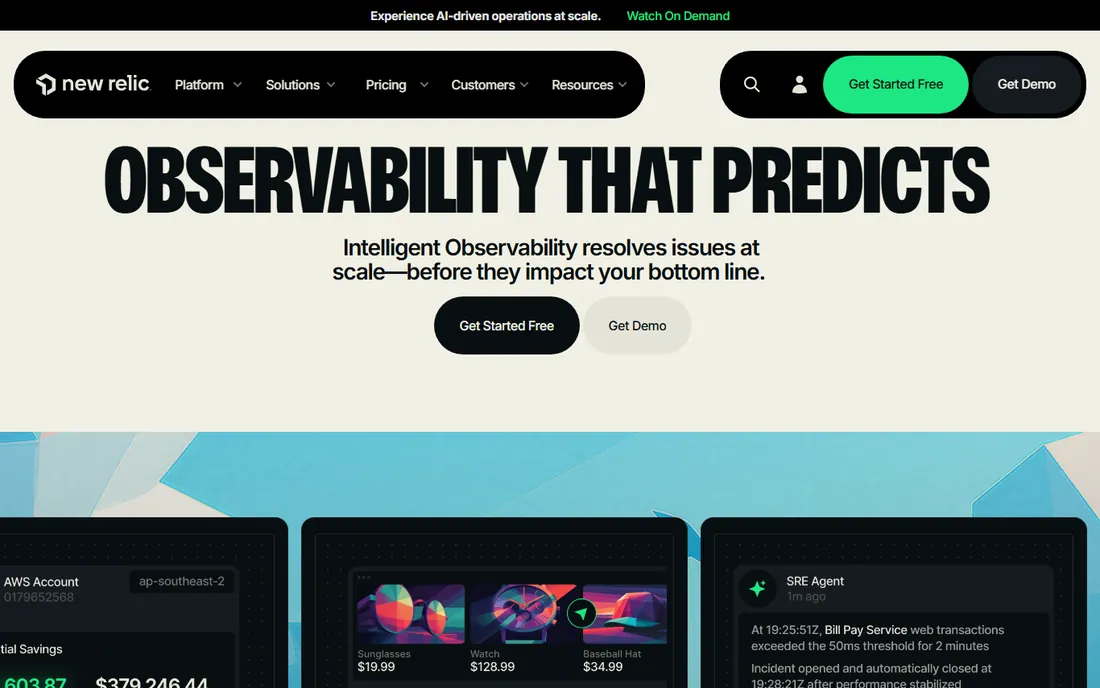
New Relic rebuilt its pricing around users and data ingest instead of hosts, which makes it one of the easiest bills in this category to predict. The free tier is genuinely useful: one full platform user, unlimited basic users, and 100 GB of ingest a month with no card required. Paid Standard starts small, and Pro scales up with unlimited users. If your team hates surprise invoices, this is the calmest option on the list.
What we like- 100 GB monthly ingest free
- No per-host counting
- 800+ integrations
Watch out for- Data overages at $0.40/GB add up if your logging is chatty
#3
Grafana Cloud
Best for: Teams invested in open-source observability standards
Visit grafana.com
Starting price$19/month platform fee plus usage
Free planYes
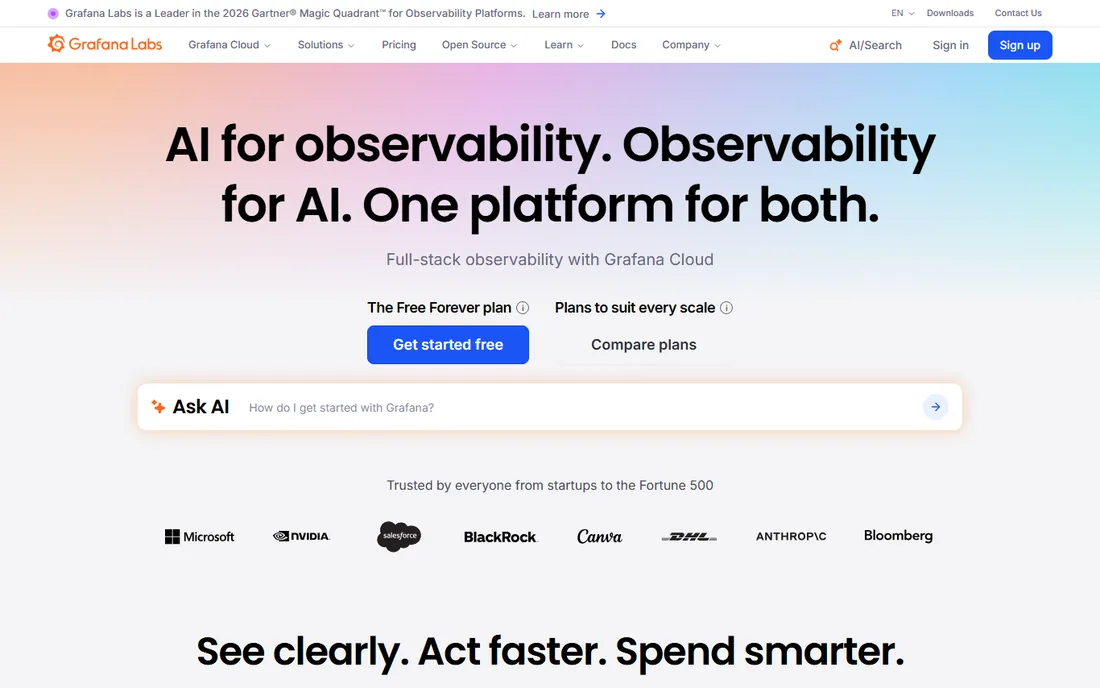
Grafana Cloud is the pick for teams that already think in Prometheus and OpenTelemetry. The free tier covers 10k active series, 50 GB of logs, and 50 GB of traces a month, which is enough to run a small production setup without paying. Paid plans start with a $19 monthly platform fee plus usage. Because it is built on open standards, you can leave for self-hosted Grafana later without re-instrumenting everything.
What we like- Generous free tier
- Vendor-neutral data
- Easy path to self-hosting
Watch out for- You assemble more of the experience yourself
- Less hand-holding than Datadog
#4
Dynatrace
Best for: Large enterprises with complex, hard-to-map environments
Visit dynatrace.com
Starting price$7/host/month (Foundation)
Free planFree trial
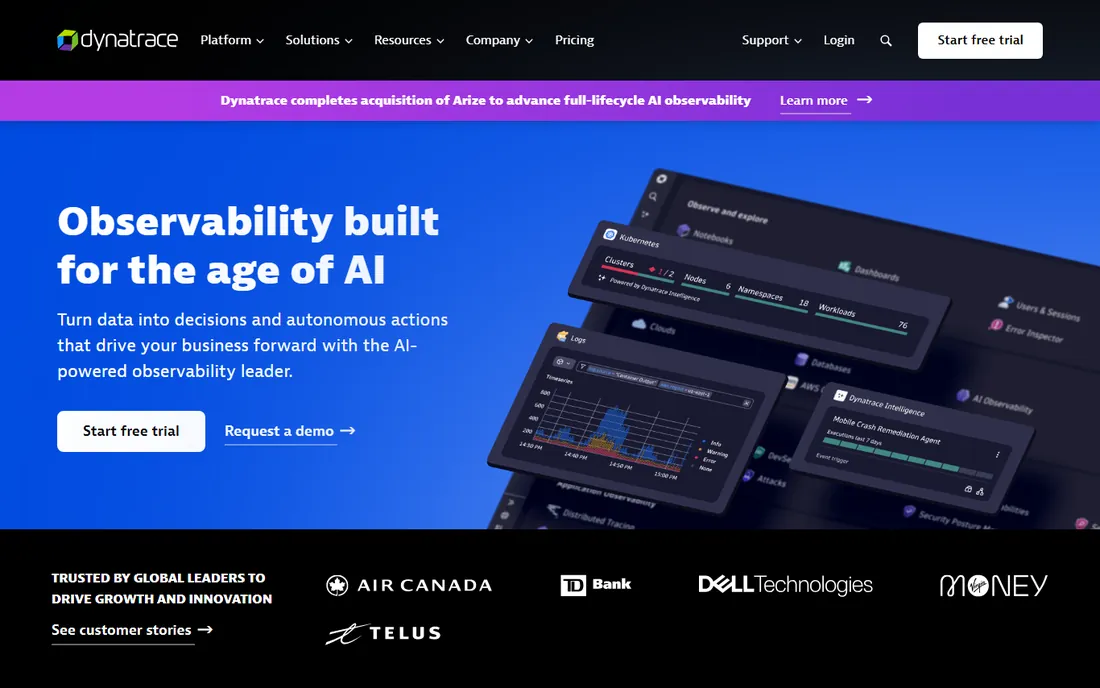
Dynatrace takes the most opinionated approach here: one agent per host that auto-discovers your whole stack, with an AI engine that maps dependencies and flags root causes without much configuration. Pricing is commitment-based, with Foundation starting at $7 per host per month and full-stack monitoring at $58 per 8 GiB host. Enterprise teams with sprawling estates tend to love it; smaller teams tend to find it heavy.
What we like- Automatic topology mapping
- Strong root-cause analysis
- Unlimited seats
Watch out for- Full-stack pricing runs high
- The platform assumes a big commitment
#5
Site24x7
Best for: Small IT teams that need broad coverage on a tight budget
Visit site24x7.com
Starting price$9/month
Free planFree trial (30 days)
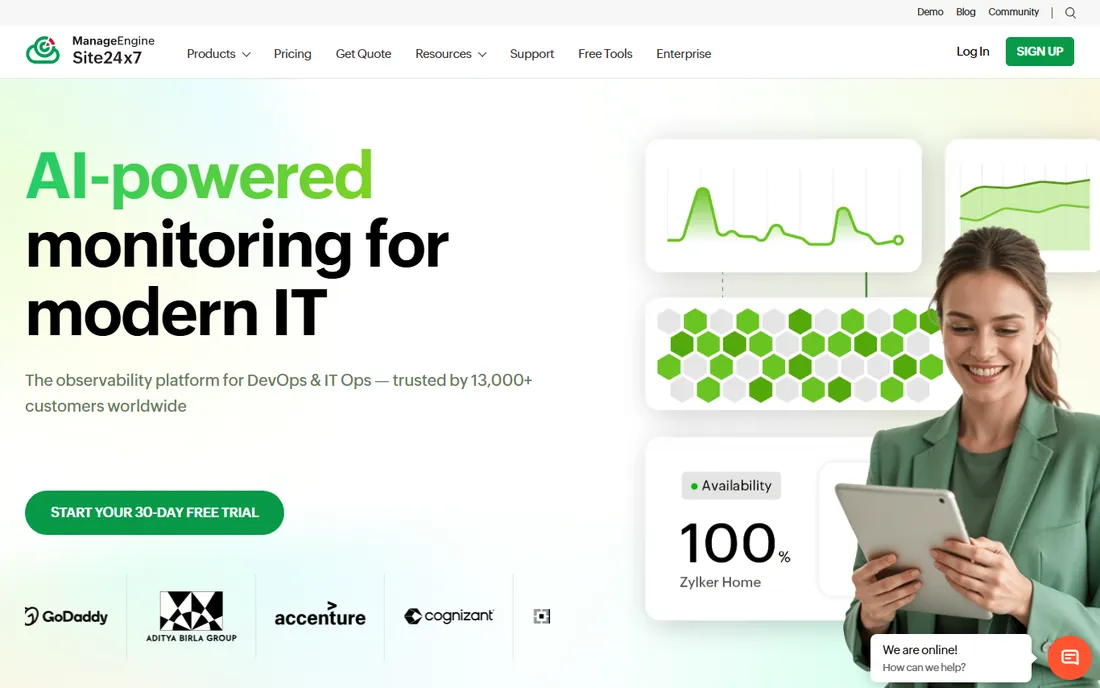
Site24x7 is the value play. It bundles website, server, cloud, APM, network, and RUM monitoring into plans that start at $9 a month, which is a fraction of what the big names charge. It is part of the ManageEngine family, so it fits naturally in shops that already use their IT tools. The interface is not as slick as the leaders, and the advanced analytics are thinner, but for small IT teams the coverage per dollar is hard to beat.
What we like- All-in-one packs from $9/month
- 130+ monitoring locations
- MSP-friendly
Watch out for- Depth in APM and analytics lags the premium platforms
Starting price$16/hybrid unit/month (Essentials)
Free planFree trial (15 days)
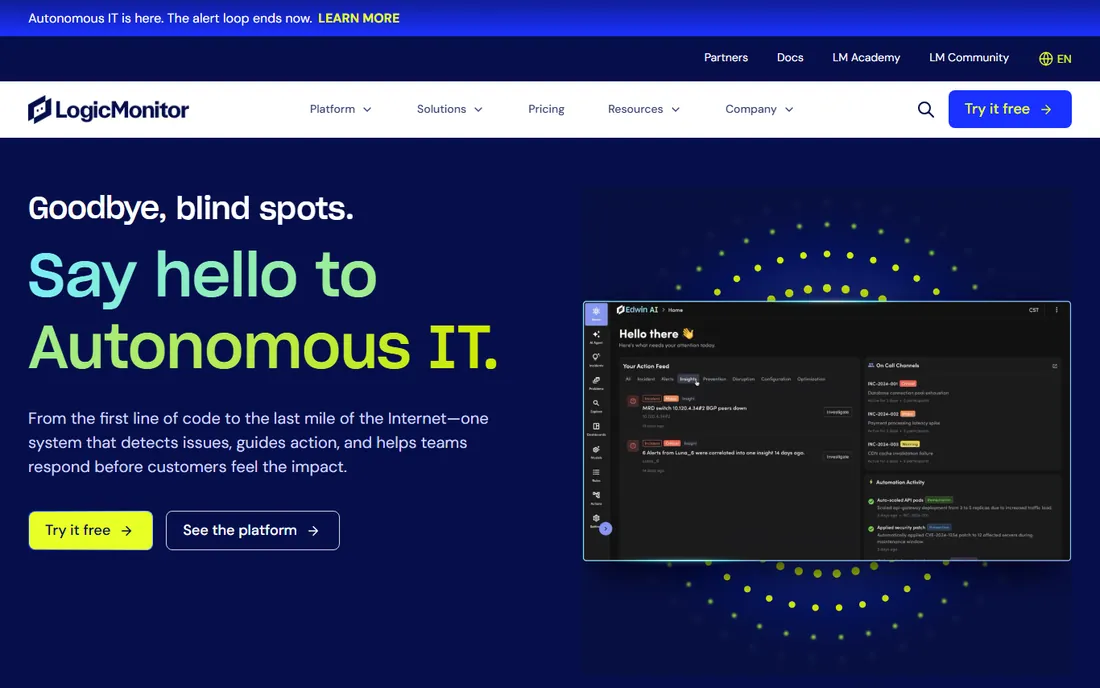
LogicMonitor built its name on hybrid infrastructure monitoring: on-prem servers, network gear, and cloud resources in one pane with genuinely good auto-discovery. Its packaging is refreshingly simple, with Essentials from $16 per hybrid unit a month, Advanced at $27, and Signature with Edwin AI at $53. The hybrid unit normalizes different resource types into one meter, which makes budgeting sane. It is less of an APM-first tool than Datadog or Dynatrace, so pair it accordingly.
What we like- Excellent auto-discovery
- 3,000+ integrations
- One licensing unit for everything
Watch out for- APM depth is thinner than the observability-first leaders
#7
Splunk Observability Cloud
Best for: Teams that need streaming, real-time analytics and already buy Cisco
Visit splunk.com
Starting price$15/host/month (Infrastructure, billed annually)
Free planFree trial
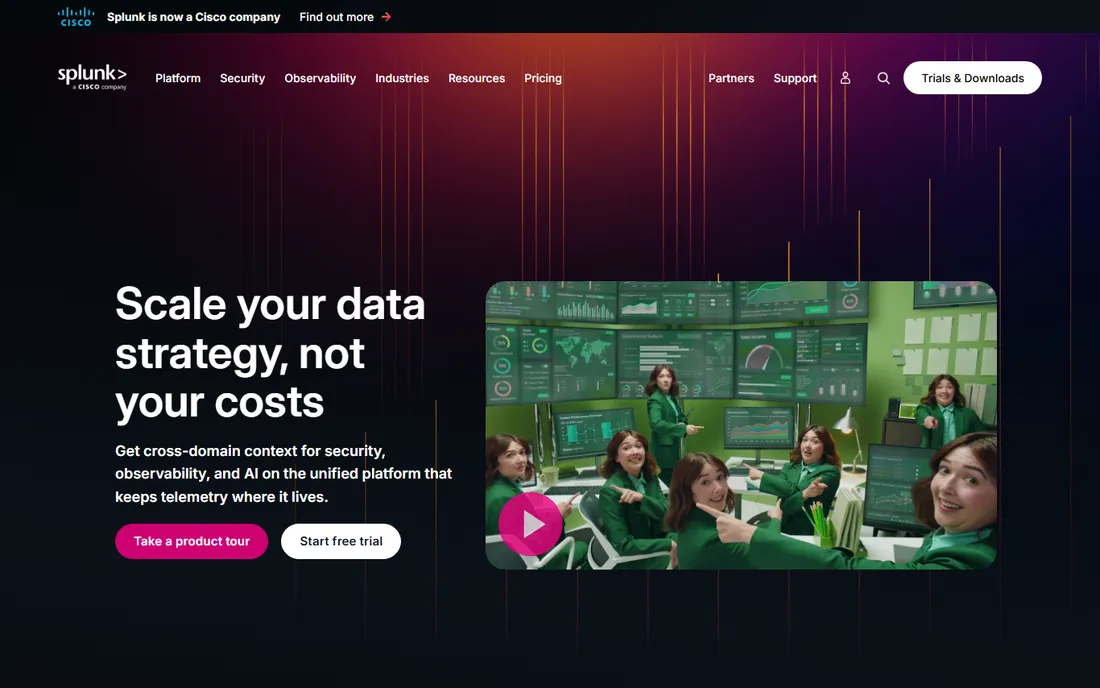
Splunk Observability Cloud, built on the old SignalFx streaming architecture, is the real-time specialist: metrics stream in with sub-second latency, which matters when you are watching for anomalies as they happen rather than after the fact. Infrastructure monitoring starts at $15 per host per month billed annually, with bundled App and Infra at $60 and end-to-end at $75. As part of Cisco, it now sits next to AppDynamics and ThousandEyes, which is convenient if your company already standardizes on Cisco.
What we like- True streaming architecture
- Strong Kubernetes support
- OpenTelemetry native
Watch out for- The broader Splunk platform pricing (ingest-based) can confuse buyers
#8
Elastic Cloud
Best for: Log-heavy teams already comfortable with the Elastic Stack
Visit elastic.co
Starting priceFrom $16.40/month
Free planYes
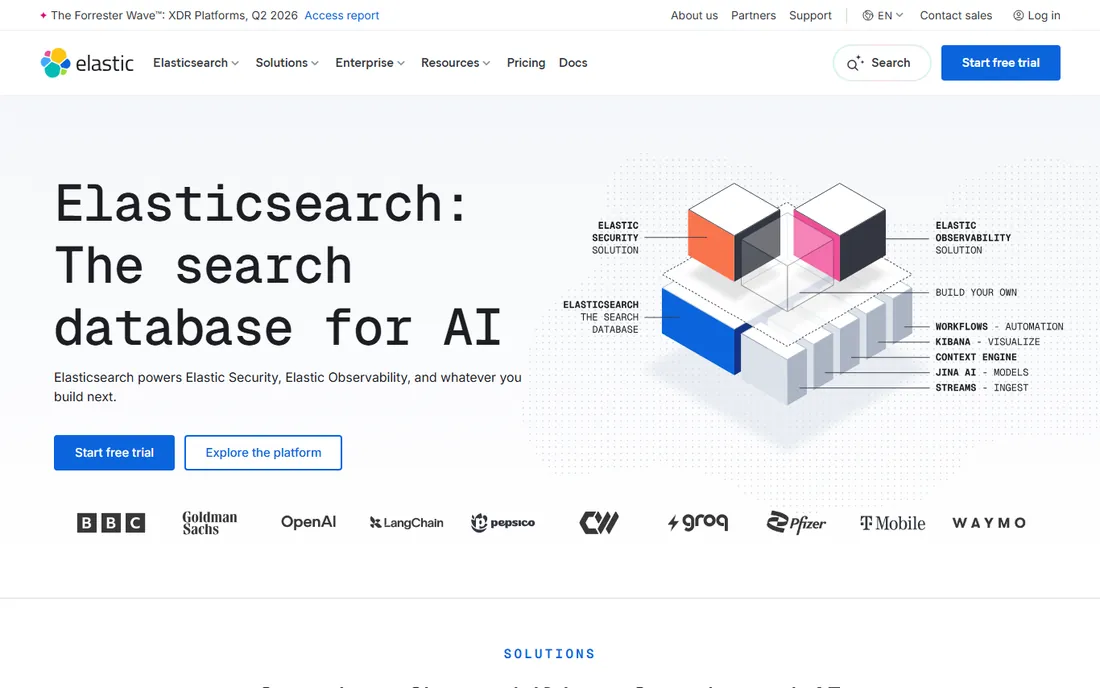
Elastic Cloud is the managed home of Elasticsearch and Kibana, and it shines for teams whose observability strategy is log-centric. If your engineers already think in Kibana queries, the learning curve is zero. Hosted deployments start from about $16.40 a month, and there is a free tier to get going. The pricing is resource-based rather than host-based, which suits variable workloads. Just remember that Elasticsearch clusters need care and feeding at scale, even managed ones.
What we like- Best-in-class log search
- Resource-based pricing
- Runs on AWS, GCP, and Azure
Watch out for- Metrics and APM feel secondary to the search experience
#9
AWS CloudWatch
Best for: AWS-centric teams that want native integration with zero setup
Visit aws.amazon.com
Starting pricePay as you go (free tier included)
Free planYes
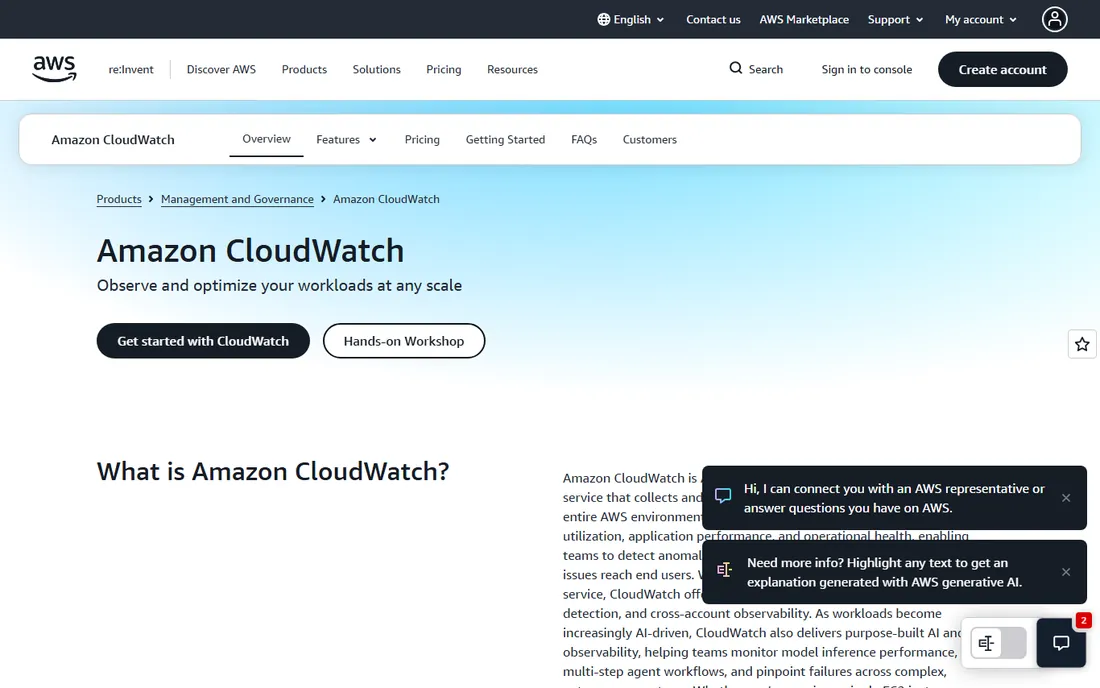
CloudWatch is the monitoring service you already pay for if you run on AWS. It collects metrics, logs, and traces across nearly every AWS service with no agent to install, and the free tier covers a solid baseline. Pricing is pure pay-as-you-go: metrics, log ingestion, and alarms each have their own meter. It is the cheapest way to get decent AWS-native observability, and the new CloudWatch Omni adds AI-powered investigation. The catch is that multi-cloud and on-prem coverage feels bolted on compared to the dedicated platforms.
What we like- Native to every AWS service
- Generous free tier
- No extra agent needed
Watch out for- Weaker outside AWS
- Costs get murky with heavy custom metrics and logs
#10
SolarWinds Observability
Best for: Network-centric teams that want SaaS or self-hosted options
Visit solarwinds.com
Starting price$15.75/node/month (Network and Infrastructure, SaaS)
Free planFree trial
SolarWinds Observability comes in both SaaS and self-hosted flavors, which is rare on this list and matters if you have data residency rules. The SaaS pricing is modular: network and infrastructure observability from $15.75 per node per month, logs from $5 per GB, and APM from $27.50 per service. Network teams that grew up on SolarWinds will find the mental model familiar. Pricing requires multi-year annual contracts, so negotiate before you sign.
What we like- Self-hosted option
- Strong network monitoring roots
- Modular pricing
Watch out for- Multi-year contracts
- The SaaS UI is still catching up to cloud-native rivals
The pricing trap everyone walks into
Nearly every over-budget monitoring story follows the same script. Logs get shipped with default retention, nobody sets up exclusion filters, and three months later the log line item is bigger than the infrastructure line item. Datadog, New Relic, Splunk, and Elastic all bill logs by volume, so the fix is the same everywhere: ship only what you will actually query, keep hot retention short, and push the rest to cheap archive storage. The second trap is custom metrics. High-cardinality tags, like user IDs or request IDs on every metric, multiply your bill silently. Set a cardinality policy before your first deploy, not after the first invoice.
#1
Datadog
Best for: Growing engineering teams that want one platform for metrics, traces, and logs
Visit datadoghq.com
Starting price$15/host/month (Infrastructure Pro, billed annually)
Free planFree trial
Datadog is the platform most cloud teams end up on, and the reason is boring: it covers infrastructure, APM, logs, synthetics, and RUM in one place with more than a thousand integrations. Once your team is bigger than a handful of engineers, that consolidation starts to matter more than any single feature. The watch-out is cost discipline. Every product is metered separately, so you have to set retention and sampling policies early or the bill grows on its own.
What we like- Huge integration library
- Strong Kubernetes support
- Dashboards your team will actually use
Watch out for- Costs stack up fast across modules
- You need someone watching the meter
#2
New Relic
Best for: Teams that want predictable, user-based pricing with a real free tier
Visit newrelic.com
Starting priceFree $0; Standard from $10/user/month
Free planYes
New Relic rebuilt its pricing around users and data ingest instead of hosts, which makes it one of the easiest bills in this category to predict. The free tier is genuinely useful: one full platform user, unlimited basic users, and 100 GB of ingest a month with no card required. Paid Standard starts small, and Pro scales up with unlimited users. If your team hates surprise invoices, this is the calmest option on the list.
What we like- 100 GB monthly ingest free
- No per-host counting
- 800+ integrations
Watch out for- Data overages at $0.40/GB add up if your logging is chatty
#3
Grafana Cloud
Best for: Teams invested in open-source observability standards
Visit grafana.com
Starting price$19/month platform fee plus usage
Free planYes
Grafana Cloud is the pick for teams that already think in Prometheus and OpenTelemetry. The free tier covers 10k active series, 50 GB of logs, and 50 GB of traces a month, which is enough to run a small production setup without paying. Paid plans start with a $19 monthly platform fee plus usage. Because it is built on open standards, you can leave for self-hosted Grafana later without re-instrumenting everything.
What we like- Generous free tier
- Vendor-neutral data
- Easy path to self-hosting
Watch out for- You assemble more of the experience yourself
- Less hand-holding than Datadog
#4
Dynatrace
Best for: Large enterprises with complex, hard-to-map environments
Visit dynatrace.com
Starting price$7/host/month (Foundation)
Free planFree trial
Dynatrace takes the most opinionated approach here: one agent per host that auto-discovers your whole stack, with an AI engine that maps dependencies and flags root causes without much configuration. Pricing is commitment-based, with Foundation starting at $7 per host per month and full-stack monitoring at $58 per 8 GiB host. Enterprise teams with sprawling estates tend to love it; smaller teams tend to find it heavy.
What we like- Automatic topology mapping
- Strong root-cause analysis
- Unlimited seats
Watch out for- Full-stack pricing runs high
- The platform assumes a big commitment
#5
Site24x7
Best for: Small IT teams that need broad coverage on a tight budget
Visit site24x7.com
Starting price$9/month
Free planFree trial (30 days)
Site24x7 is the value play. It bundles website, server, cloud, APM, network, and RUM monitoring into plans that start at $9 a month, which is a fraction of what the big names charge. It is part of the ManageEngine family, so it fits naturally in shops that already use their IT tools. The interface is not as slick as the leaders, and the advanced analytics are thinner, but for small IT teams the coverage per dollar is hard to beat.
What we like- All-in-one packs from $9/month
- 130+ monitoring locations
- MSP-friendly
Watch out for- Depth in APM and analytics lags the premium platforms
Starting price$16/hybrid unit/month (Essentials)
Free planFree trial (15 days)
LogicMonitor built its name on hybrid infrastructure monitoring: on-prem servers, network gear, and cloud resources in one pane with genuinely good auto-discovery. Its packaging is refreshingly simple, with Essentials from $16 per hybrid unit a month, Advanced at $27, and Signature with Edwin AI at $53. The hybrid unit normalizes different resource types into one meter, which makes budgeting sane. It is less of an APM-first tool than Datadog or Dynatrace, so pair it accordingly.
What we like- Excellent auto-discovery
- 3,000+ integrations
- One licensing unit for everything
Watch out for- APM depth is thinner than the observability-first leaders
#7
Splunk Observability Cloud
Best for: Teams that need streaming, real-time analytics and already buy Cisco
Visit splunk.com
Starting price$15/host/month (Infrastructure, billed annually)
Free planFree trial
Splunk Observability Cloud, built on the old SignalFx streaming architecture, is the real-time specialist: metrics stream in with sub-second latency, which matters when you are watching for anomalies as they happen rather than after the fact. Infrastructure monitoring starts at $15 per host per month billed annually, with bundled App and Infra at $60 and end-to-end at $75. As part of Cisco, it now sits next to AppDynamics and ThousandEyes, which is convenient if your company already standardizes on Cisco.
What we like- True streaming architecture
- Strong Kubernetes support
- OpenTelemetry native
Watch out for- The broader Splunk platform pricing (ingest-based) can confuse buyers
#8
Elastic Cloud
Best for: Log-heavy teams already comfortable with the Elastic Stack
Visit elastic.co
Starting priceFrom $16.40/month
Free planYes
Elastic Cloud is the managed home of Elasticsearch and Kibana, and it shines for teams whose observability strategy is log-centric. If your engineers already think in Kibana queries, the learning curve is zero. Hosted deployments start from about $16.40 a month, and there is a free tier to get going. The pricing is resource-based rather than host-based, which suits variable workloads. Just remember that Elasticsearch clusters need care and feeding at scale, even managed ones.
What we like- Best-in-class log search
- Resource-based pricing
- Runs on AWS, GCP, and Azure
Watch out for- Metrics and APM feel secondary to the search experience
#9
AWS CloudWatch
Best for: AWS-centric teams that want native integration with zero setup
Visit aws.amazon.com
Starting pricePay as you go (free tier included)
Free planYes
CloudWatch is the monitoring service you already pay for if you run on AWS. It collects metrics, logs, and traces across nearly every AWS service with no agent to install, and the free tier covers a solid baseline. Pricing is pure pay-as-you-go: metrics, log ingestion, and alarms each have their own meter. It is the cheapest way to get decent AWS-native observability, and the new CloudWatch Omni adds AI-powered investigation. The catch is that multi-cloud and on-prem coverage feels bolted on compared to the dedicated platforms.
What we like- Native to every AWS service
- Generous free tier
- No extra agent needed
Watch out for- Weaker outside AWS
- Costs get murky with heavy custom metrics and logs
#10
SolarWinds Observability
Best for: Network-centric teams that want SaaS or self-hosted options
Visit solarwinds.com
Starting price$15.75/node/month (Network and Infrastructure, SaaS)
Free planFree trial
SolarWinds Observability comes in both SaaS and self-hosted flavors, which is rare on this list and matters if you have data residency rules. The SaaS pricing is modular: network and infrastructure observability from $15.75 per node per month, logs from $5 per GB, and APM from $27.50 per service. Network teams that grew up on SolarWinds will find the mental model familiar. Pricing requires multi-year annual contracts, so negotiate before you sign.
What we like- Self-hosted option
- Strong network monitoring roots
- Modular pricing
Watch out for- Multi-year contracts
- The SaaS UI is still catching up to cloud-native rivals
Agent overhead, the question nobody asks sales
Every vendor on this list will tell you their agent is lightweight. Test it yourself. Install the agent on a staging host that mirrors production, run your normal load, and measure CPU, memory, and network egress before you commit. A 2% overhead per host sounds trivial until you multiply it by 400 hosts. Also ask how the agent behaves when the backend is unreachable: does it buffer, drop, or retry itself into a bigger problem? The vendors with good answers to that question are the ones you want paging you at 3 a.m.
How we chose
We did not run hands-on trials for this guide. Instead we evaluated each tool the way a careful buyer would: reading the vendor's own pricing pages and product documentation, checking the metering model for hosts, logs, metrics and data ingest, and cross-checking claims against public reviews on G2, Capterra and engineering forums. We favored tools with transparent pricing, genuinely usable free tiers and clear documentation of how each meter works, and we weighted total-cost predictability heavily, since the sticker price in this category rarely survives contact with production log volume.
Frequently asked questions
How much does cloud monitoring software cost?
It ranges from free to thousands a month. Small setups can run on free tiers from New Relic, Grafana Cloud, or Elastic, or start around $9 to $19 a month with Site24x7 or Grafana Cloud. Mid-size teams typically spend $15 to $60 per host per month with Datadog, Splunk, or Dynatrace, plus log and data charges that often exceed the host fees. Budget for logs separately; they are the usual surprise.
Do I need APM, or is infrastructure monitoring enough?
Infrastructure monitoring tells you a server is sick. APM tells you which line of code made it sick. If you run custom applications, you need APM. If you mostly run off-the-shelf software and care about uptime and resource usage, infrastructure monitoring plus synthetics is usually enough.
Can one tool monitor multiple clouds?
Yes. Datadog, Dynatrace, New Relic, Grafana Cloud, LogicMonitor, and Splunk all monitor AWS, Azure, and GCP from one console, plus on-prem. CloudWatch and Azure-native tools work best inside their own cloud. If you are multi-cloud, pick a vendor-neutral platform from the start.
How long does it take to set up cloud monitoring?
Basic agent-based setup takes hours, not weeks. Install the agent on your hosts or connect your cloud account, and most tools auto-discover services and start populating dashboards the same day. The slow part is tuning: alerts, dashboards, and log pipelines that match how your team actually works. Plan for a week of iteration before the setup feels finished.
What is the difference between monitoring and observability?
Monitoring watches known problems: is the server up, is the error rate above the threshold. Observability gives you the raw data (metrics, logs, traces) to investigate problems you did not predict. In practice, the tools on this list do both. Vendors use "observability" for the full data platform and "monitoring" for the alerting layer, but you are buying the same product either way.
Final verdict
If you want the safe default, Datadog is the safe default. If you want the calmest bill, New Relic or Grafana Cloud. If you are an enterprise with a maze of an estate, Dynatrace earns its price. And if you are on a budget, Site24x7 covers more ground per dollar than anything else here. Whichever you pick, set log retention and metric cardinality policies on day one. Your future self, reading the invoice, will thank you.
Sources we checked (10)
- https://www.datadoghq.com/pricing/
- https://newrelic.com/pricing
- https://grafana.com/pricing/
- https://www.dynatrace.com/pricing/
- https://www.site24x7.com/site24x7-pricing.html
- https://www.logicmonitor.com/pricing/
- https://www.splunk.com/en_us/products/pricing/observability.html
- https://www.elastic.co/pricing
- https://aws.amazon.com/cloudwatch/pricing/
- https://www.solarwinds.com/solarwinds-observability/pricing
Is your product missing or out of date?
We review this list regularly. Vendors can request a listing, send updated pricing or ask about featured placement.

Shihab Mia · Founder, Rankite
Shihab has spent more than a decade helping SaaS and e-commerce brands grow through search. He writes Rankite's software buying guides from pricing pages, documentation and public user reviews. More about Shihab.