How we make this list: we compare pricing pages, product documentation and public user reviews. Rankite is independent; if a vendor ever pays for a featured spot, that listing is clearly labeled Partner.
Key takeaways
- MATLAB remains the standard for engineering 3D visualization, with a standard individual license at $1,050 per year, according to MathWorks' own pricing.
- GeoGebra and Desmos plot 3D surfaces free in a browser, which is enough for teaching and quick exploration.
- Mathematica and Maple are the picks when the math itself is the hard part: symbolic computation with 3D output built in.
- OriginPro and Grapher serve scientists who need publication-ready 3D graphs without writing code.
- Surfer is the specialist for 3D terrain and surface maps from real-world data, at $1,449 for a single-user license.
Quick comparison
| Tool | Best for | Starting price | Free plan |
|---|
 MATLAB MATLAB | Engineering teams with serious math | $1,050/year (Standard annual) | Free trial (30 days) |
 Wolfram Mathematica Wolfram Mathematica | Symbolic math and publication graphics | See website | Free trial |
 GeoGebra GeoGebra | Teaching and quick 3D plots | Free | Yes |
 Desmos 3D Calculator Desmos 3D Calculator | Instant browser-based 3D graphs | Free | Yes |
 OriginPro OriginPro | Publication-quality scientific graphs | See website | Free trial |
 Grapher Grapher | 2D/3D graphs without coding | See website | Free trial |
 Maple Maple | Interactive math exploration | $305/year (Personal Edition) | Free trial |
 Surfer Surfer | 3D surface and terrain mapping | $1,449 one-time (single-user) | Free trial (14 days) |
 CalcPlot3D CalcPlot3D | Free calculus visualization | Free | Yes |
Is your product missing or out of date?
We review this list regularly. Vendors can request a listing, send updated pricing or ask about featured placement.
The best 3d graphing software
Starting price$1,050/year (Standard annual)
Free planFree trial (30 days)
A single MATLAB license lists at $2,625 perpetual for a named user on MathWorks' North America price list, which tells you this is professional infrastructure, not a casual purchase. For most buyers the relevant figure is the $1,050 per year standard annual license. What that buys in 3D graphing is depth: surface plots, mesh plots, contour slices, volume rendering and animations, all scriptable, all integrated with the computation that produced the data. When the plot is the last step of a long analysis pipeline, MATLAB keeps everything in one environment.
The cost structure deserves attention. Toolboxes are separate products, and a serious setup accumulates them. Students and home users get much cheaper options, but commercial use requires the standard license. A 30-day trial is fully functional. For engineering teams that already compute in MATLAB, the 3D graphics are a natural extension. For everyone else, the free tools below cover a surprising amount of the same ground.
What we like- Huge 3D plotting library
- Toolboxes for every domain
- Massive user community
Watch out for- Expensive for individuals
- Code-based workflow has a learning curve
#2
Wolfram Mathematica
Best for: Symbolic math and publication graphics
Visit wolfram.com
Starting priceSee website
Free planFree trial
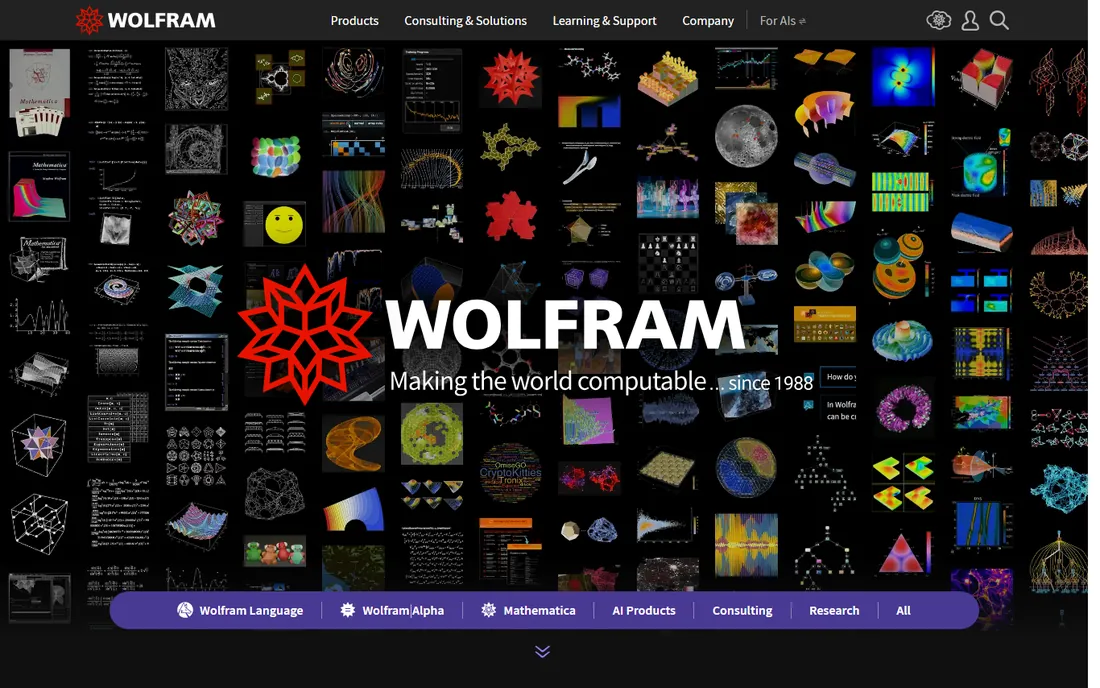
Mathematica occupies the same territory as MATLAB but from the symbolic side: it differentiates, integrates and solves before it plots, and the 3D graphics inherit that intelligence. Plot3D, ParametricPlot3D and ListPlot3D produce clean, publication-ready surfaces with minimal fiddling, and interactive manipulation lets you rotate and slice the result live. For researchers whose work moves between equations and visualization, the combination is hard to match.
Pricing is quote-based for commercial desktop licenses, with cloud plans published separately, so check Wolfram's current pages for your category. Education and student pricing is substantially lower. The Wolfram Language is powerful but idiosyncratic; budget learning time if your team comes from Python or MATLAB. A free trial lets you test the plotting on your own problems before talking to sales.
What we like- Symbolic computation plus 3D output
- Beautiful default graphics
- Huge knowledge base
Watch out for- Premium pricing
- Unique language to learn
Starting priceFree
Free planYes
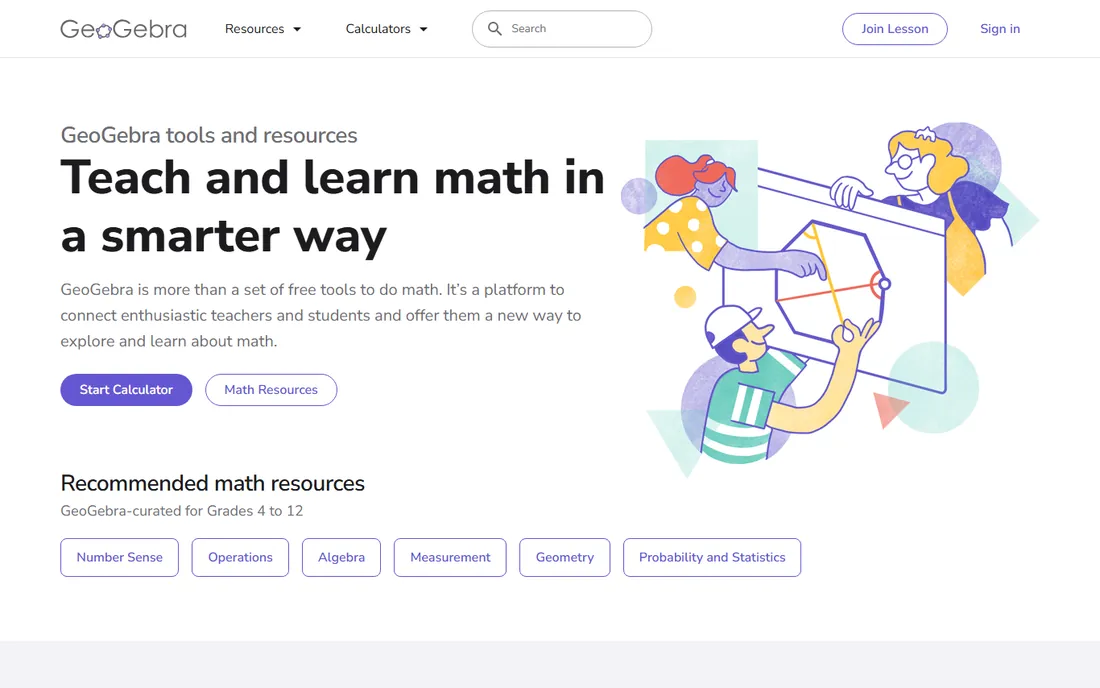
GeoGebra is the rare tool that is both free and genuinely good at its job. The 3D Calculator plots surfaces, parametric curves and solids directly in the browser, with sliders that animate parameters in real time. Teachers use it to show a class what z = x^2 - y^2 actually looks like; students use it to check homework; professionals use it for quick sanity checks before committing to heavier tools. No install, no license, no account needed for the basics.
The limits are honest ones. GeoGebra is not a numerical computing environment, so large datasets and complex simulations belong elsewhere. Export options are fine for slides and handouts but not journal-grade. For its intended audience, though, the price-to-value ratio is unbeatable, and the large educator community means tutorials for almost any topic.
What we like- Completely free
- Runs in the browser
- Great for education
Watch out for- Not built for heavy computation
- Limited export polish
#4
Desmos 3D Calculator
Best for: Instant browser-based 3D graphs
Visit desmos.com
Starting priceFree
Free planYes
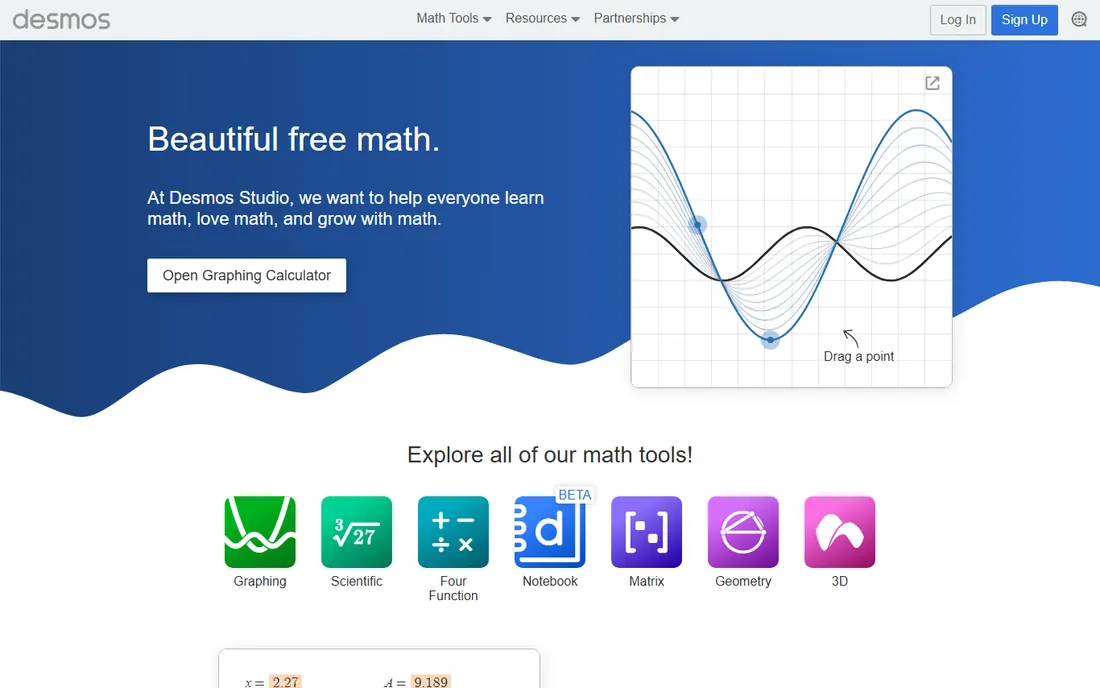
Desmos took the graphing calculator and put it in the browser, and the 3D calculator extends that to surfaces and solids. Type an equation and the graph appears, rotatable with the mouse, shareable with a link. There is essentially no learning curve, which is why it dominates high-school and early-college math. For quick "what does this look like" questions, nothing is faster.
It is deliberately simple: no scripting, no data import, no heavy analysis. That is the point. When a meeting, a classroom or a study session needs a 3D plot in ten seconds, Desmos is the tool. For anything beyond exploration, step up to GeoGebra for free or to a paid tool for production work.
What we like- Zero learning curve
- Instant sharing via link
- Free forever
Watch out for- Basic feature set
- No offline desktop app
Starting priceSee website
Free planFree trial
OriginPro is what working scientists reach for when a 3D graph has to survive peer review. The 3D plotting covers surface, wireframe, contour and waterfall plots with fine control over every visual element, and the template system lets a lab standardize figure styles across a team. Built-in statistics and curve fitting mean the analysis and the figure live in the same project. It is Windows software with decades of refinement behind it.
Commercial pricing is quote-based rather than published, which is the main friction for small buyers; academic and student pricing is much friendlier. A free trial is available. If your output is figures for papers, grants or reports, OriginPro's polish justifies the conversation with sales. If your output is exploration, the free tools are enough.
What we like- Journal-ready 3D graphs
- Strong statistics
- Template workflows
Watch out for- Quote-based commercial pricing
- Windows-centric
Starting priceSee website
Free planFree trial
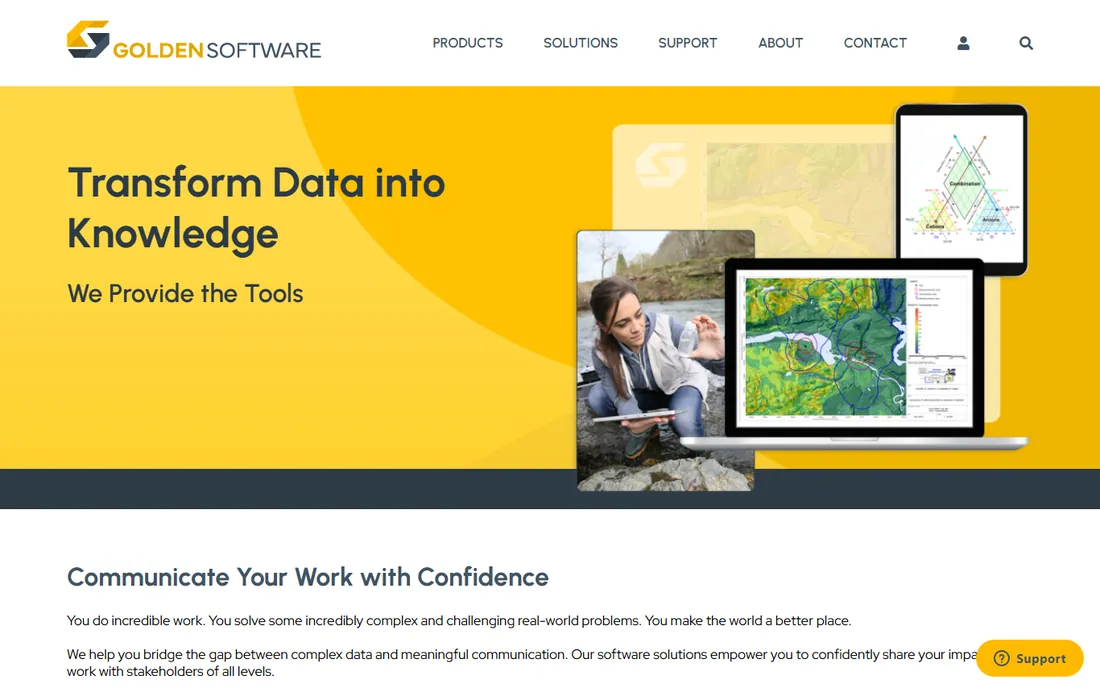
Grapher, from Golden Software, is for people who need serious graphs but do not code. Pick from dozens of 2D and 3D graph types, point the software at your data, and adjust everything through dialogs rather than scripts. The 3D surface and wireframe plots are clean and customizable, and the learning curve is days rather than months. It is a comfortable middle ground between a spreadsheet chart and a programming environment.
Golden Software does not publish list pricing, so expect a quote process; reseller listings suggest a mid-range perpetual license. A free trial is available. Windows-only is the main limitation. For small teams that need better-than-Excel 3D visualization without hiring a programmer, Grapher is worth evaluating against OriginPro.
What we like- No programming needed
- 80+ graph types
- Clean defaults
Watch out for- Windows only
- Pricing not published
Starting price$305/year (Personal Edition)
Free planFree trial
Maple's pitch is that you should not have to learn a programming language to do serious math. Its clickable interface lets you build equations, solve them and plot the results in 3D with point-and-click steps, which makes it popular in teaching and in engineering groups that value accessibility. The 3D plots are interactive and exportable, and the document interface keeps the math, the plot and the explanation together.
The Personal Edition at $305 per year is the accessible entry point, though it excludes commercial, teaching and research use. Commercial licenses cost substantially more and are quote-based. A free trial is available. Maple sits between the free classroom tools and the heavyweight platforms: more capable than GeoGebra, friendlier than MATLAB, and priced accordingly.
What we like- Clickable math interface
- Strong 3D plotting
- Affordable personal edition
Watch out for- Commercial licenses are pricey
- Smaller community than MATLAB
Starting price$1,449 one-time (single-user)
Free planFree trial (14 days)
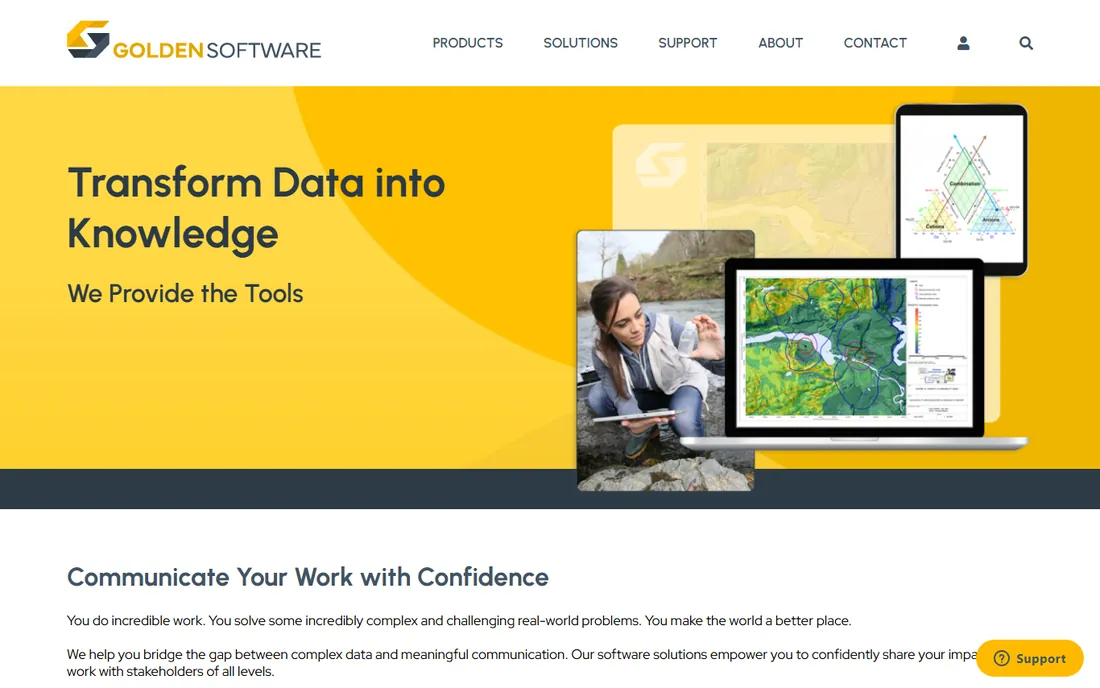
Surfer does one thing exceptionally well: turning XYZ data into 3D surface maps, contour maps and terrain models. Geologists, environmental consultants and surveyors use it to visualize elevation, contamination plumes, watersheds and drill data, with gridding algorithms that handle irregular real-world measurements. If your 3D graphing starts from field data rather than equations, this is the specialist tool.
The single-user perpetual license lists at $1,449, with annual subscription options also available. A 14-day free trial is fully functional. It is unapologetically niche; nobody buys Surfer for classroom demos. But within its domain of 3D surface modeling from measured data, it has decades of refinement and a loyal professional user base.
What we like- Best-in-class 3D surface maps
- Handles real survey data
- Perpetual license
Starting priceFree
Free planYes
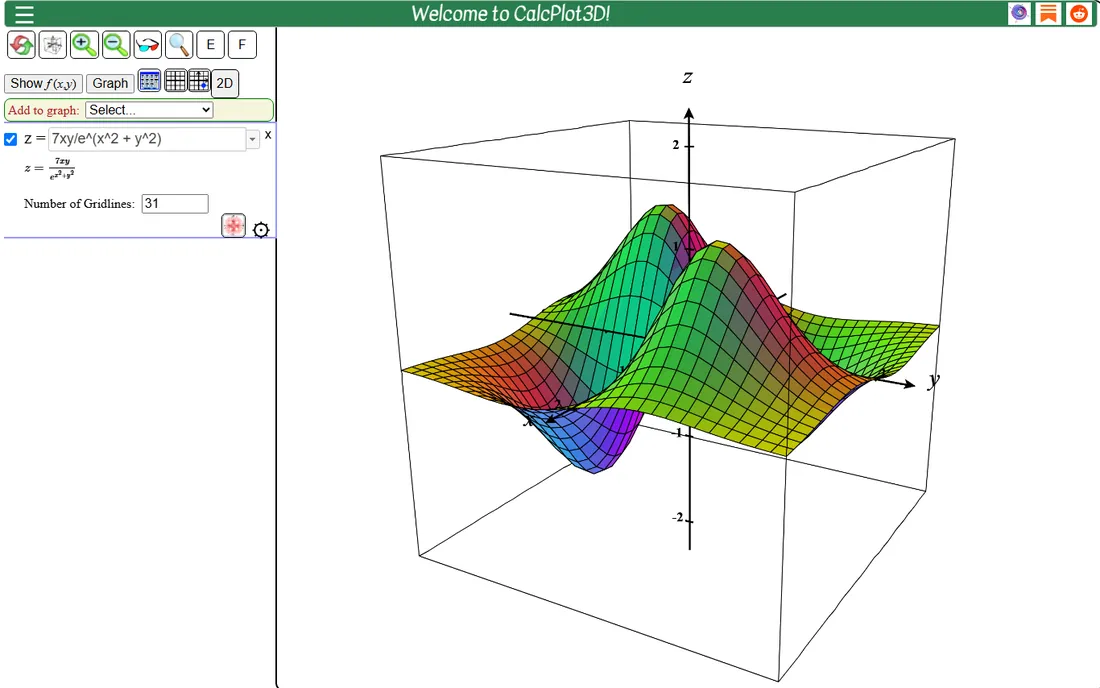
CalcPlot3D is a free, NSF-supported web app built specifically for visualizing multivariable calculus: surfaces, level curves, gradient fields, parametric surfaces and Taylor polynomials, all rotatable in the browser. It was designed by a calculus professor for calculus students, and it shows in the best way: the features map directly to what a Calc III course teaches. It now runs as a modern JavaScript app on phones and tablets as well as desktops.
It is not a general-purpose graphing package, and the interface prioritizes teaching over polish. But for its niche, it is better than tools costing thousands, because it was built for exactly this job. If you teach or study multivariable calculus, bookmark it alongside GeoGebra.
What we like- Free
- Built for multivariable calculus
- Runs in the browser
Watch out for- Education-focused
- Basic interface
How we chose
We compared 3D graphing tools by reading vendor pricing pages, documentation and public reviews, and we checked what each tool actually plots rather than relying on category labels. Pricing had to be current: we used MathWorks' published price list for MATLAB, Maplesoft's store for Maple Personal Edition and reseller MSRP for Surfer, and wrote "See website" where vendors keep pricing behind a quote process. We mixed premium platforms with free tools because the right choice depends entirely on the job.
Start with the source of your 3D data. If it comes from equations you are studying or teaching, GeoGebra, Desmos 3D and CalcPlot3D are free and immediate. If it comes from computations you are running, MATLAB or Mathematica keep the analysis and the plot together. If it comes from measurements in the field, Surfer is the purpose-built choice. If it comes from lab experiments destined for publication, OriginPro or Grapher produce the figures.
Then consider who will use it. A classroom needs zero install and zero learning curve, which points to browser tools. A research group needs reproducibility and scriptability, which points to MATLAB or Mathematica. A small business needs one person to produce good figures without becoming a programmer, which points to OriginPro or Grapher. Buy for the user, not for the feature list.
Free vs paid: where the line is
The free tools on this list are genuinely capable, not crippled demos. GeoGebra, Desmos and CalcPlot3D handle teaching, exploration and quick checks as well as anything. The paid tools earn their price in three situations: heavy computation behind the plot, publication-quality output with team templates, and specialized domains like terrain modeling. If none of those apply, start free and upgrade only when you hit a real wall.
When you do pay, watch the license model. MATLAB and Maple Personal are annual; MATLAB commercial can be perpetual; Surfer offers both. Academic pricing is often a fraction of commercial pricing, so verify your eligibility. And budget for the learning curve: a $3,000 tool nobody on the team can drive is worse than a free one they use daily.
Frequently asked questions
What is the best free 3D graphing software?
GeoGebra is the best all-round free option, with a full 3D calculator in the browser. Desmos 3D is the fastest for quick plots, and CalcPlot3D is the best free choice specifically for multivariable calculus. All three are free with no time limits.
Can Excel make 3D graphs?
Excel's 3D charting is limited to basic 3D column, surface and wireframe charts with little control. It works for simple presentations of gridded data, but it cannot plot parametric surfaces, handle large datasets gracefully or produce publication-quality output. For real 3D work, use a dedicated tool.
Do I need to know programming to use 3D graphing software?
Not necessarily. GeoGebra, Desmos, OriginPro, Grapher, Maple and Surfer all offer point-and-click 3D plotting with no coding required. MATLAB and Mathematica are most powerful through their scripting languages, though both have interactive tools for basic plots. Choose based on your comfort level.
What is the difference between MATLAB and Mathematica for 3D plots?
Both produce excellent 3D graphics. MATLAB is stronger when the plot is part of a numerical engineering workflow, with deep toolboxes and Simulink integration. Mathematica is stronger when the work starts from symbolic math, with a unified language for equations and graphics. Teams usually standardize on whichever matches their existing work.
Which 3D graphing software is best for students?
GeoGebra and Desmos are free and cover most coursework through early college. CalcPlot3D is ideal for multivariable calculus specifically. Students who need MATLAB or Mathematica should check university licenses first; most schools provide them free, and student editions are a fraction of commercial prices.
Sources we checked (6)
- https://www.mathworks.com/content/dam/mathworks/price-lists/north-america-standard.pdf
- https://www.trustradius.com/products/wolfram-mathematica/pricing
- https://store.maplesoft.com/products/usd-maple-personal-edition/
- https://www.shi.com/product/50931308/Surfer-Single-User
- https://resourcelinkai.com/reviews/detailed-reviews/ai-research-tools-detailed-reviews/originpro-detailed-review/
- https://jointmathematicsmeetings.org/amsmtgs/2197_abstracts/1135-p1-2540.pdf
Is your product missing or out of date?
We review this list regularly. Vendors can request a listing, send updated pricing or ask about featured placement.

Shihab Mia · Founder, Rankite
Shihab has spent more than a decade helping SaaS and e-commerce brands grow through search. He writes Rankite's software buying guides from pricing pages, documentation and public user reviews. More about Shihab.