How we make this list: we compare pricing pages, product documentation and public user reviews. Rankite is independent; if a vendor ever pays for a featured spot, that listing is clearly labeled Partner.
Key takeaways
- Minitab and SPSS are the classic menu-driven statistics packages, trusted in industry and academia respectively.
- R and Python (statsmodels) are the free, code-first standards for serious statistical work.
- Stata, JMP, and EViews serve economists, researchers, and time-series analysts with specialized depth.
- Excel handles simple regressions fine and is already on every analyst's computer.
Quick comparison
| Tool | Best for | Starting price | Free plan |
|---|
 Minitab Minitab | menu-driven industrial statistics | See website | Free trial |
 SPSS SPSS | academic and social science research | See website | Free trial |
 R R | free statistical programming | Free | Yes |
 statsmodels statsmodels | Python regression modeling | Free | Yes |
 Stata Stata | econometrics and research | See website | No |
 JMP JMP | visual interactive statistics | See website | Free trial |
 EViews EViews | time-series econometrics | See website | Free trial |
 Excel Excel | simple regression everyone knows | See website | Free trial |
Is your product missing or out of date?
We review this list regularly. Vendors can request a listing, send updated pricing or ask about featured placement.
The best software for regression analysis
Starting priceSee website
Free planFree trial
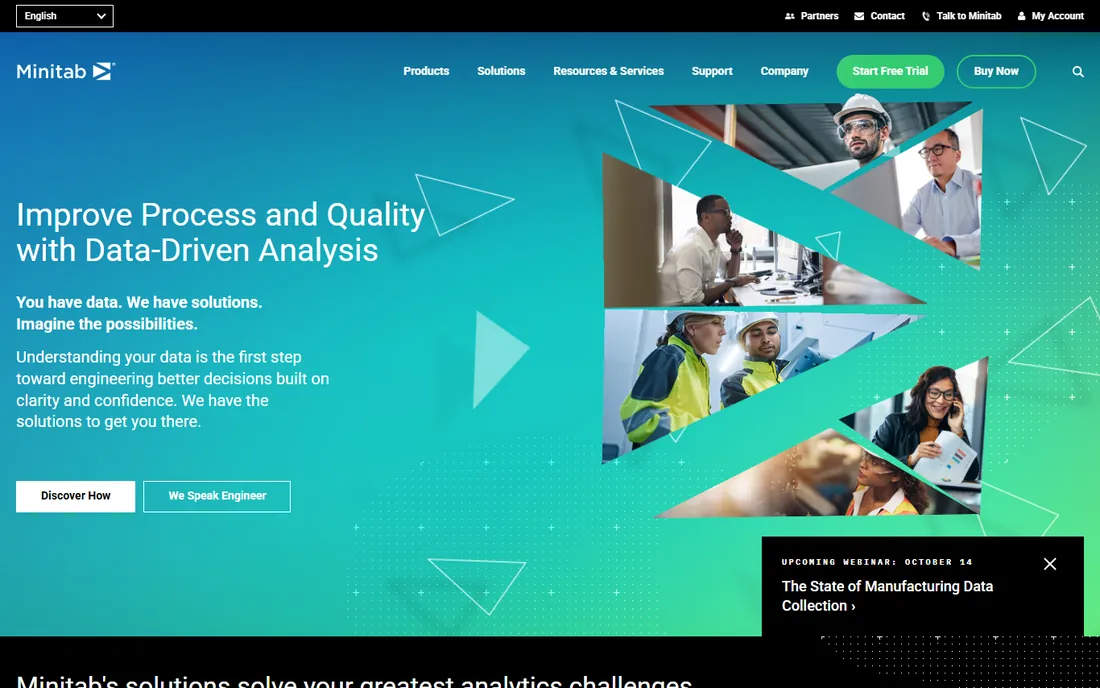
Minitab is the statistics package of manufacturing and quality engineering: Six Sigma black belts, process engineers, and quality managers run regressions, DOE, and control charts through its menus. The Assistant feature guides users to the right analysis, which matters when statistics is a tool rather than a profession.
Regression support covers the industrial needs: multiple regression, logistic regression, nonlinear models, and the diagnostics that validate them. Output is clear and presentation-ready, with graphs that communicate to non-statisticians.
Licensing costs are real, and code-based tools offer more flexibility for novel analyses. But for organizations where many people need correct statistics without becoming statisticians, Minitab's guidance is worth the price.
What we like- The standard in quality engineering
- Excellent guidance
- Reliable output
Watch out for- Expensive licenses
- Less flexible than code
#2
SPSS
Best for: academic and social science research
Visit ibm.com
Starting priceSee website
Free planFree trial
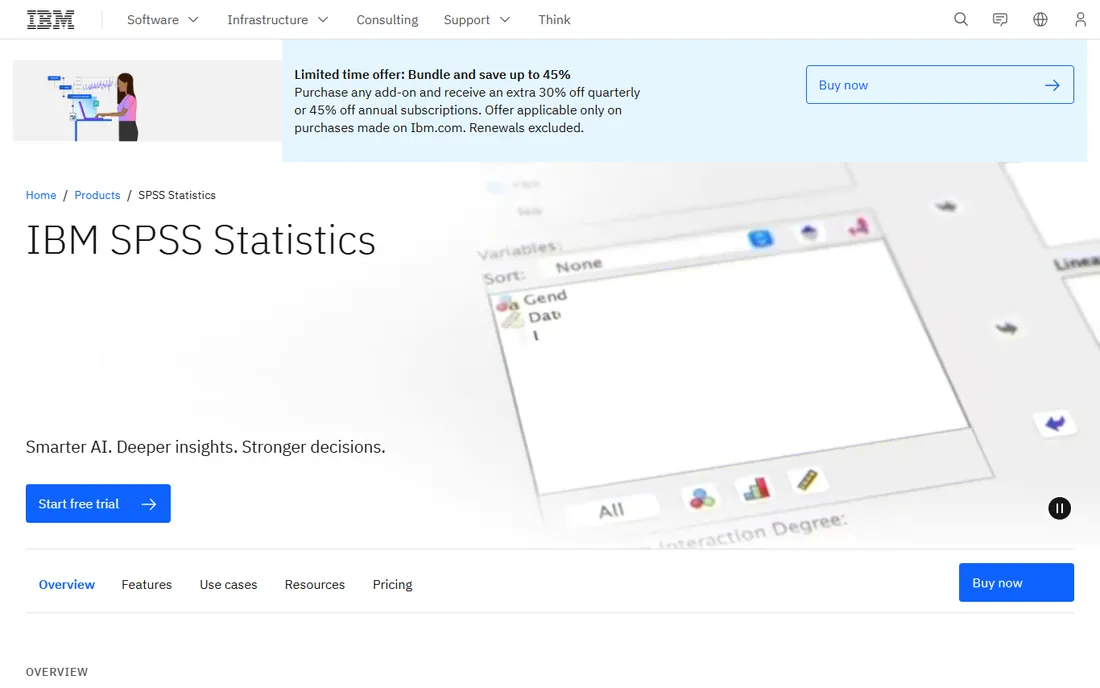
SPSS (now IBM SPSS Statistics) is the statistics software of social science: psychology, sociology, education, and market research departments teach and publish with it. The menu-driven interface makes complex analyses accessible to researchers whose expertise is their field, not statistics.
Regression procedures cover linear, logistic, ordinal, and more, with the diagnostics and output tables that academic publishing expects. The syntax system allows reproducible analyses for those who outgrow menus.
IBM pricing reflects the enterprise positioning. R does everything SPSS does for free, with more elegance, which is why graduate students increasingly learn R. But SPSS's installed base in academia and its approachability keep it standard.
What we like- The academic standard
- Extensive procedures
- Good documentation
Watch out for- Expensive
- Syntax less elegant than R
Starting priceFree
Free planYes
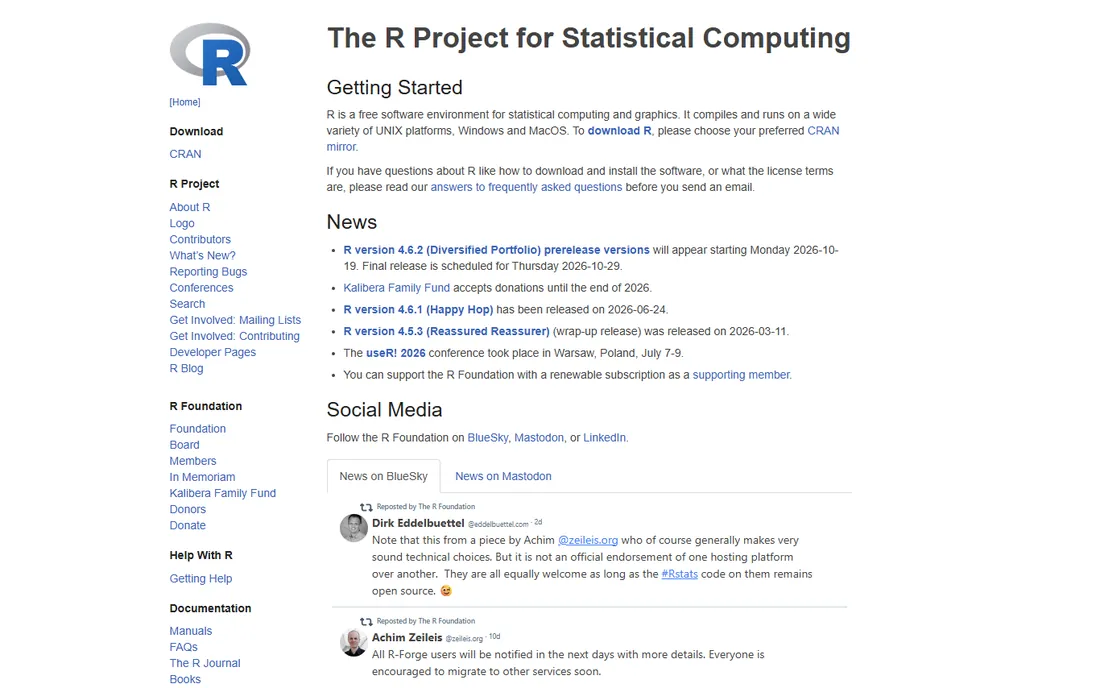
R is the free standard for statistical computing, with packages for every regression method ever published. The lm() function handles linear models in one line; specialized packages cover mixed models, outlier-resistant regression, Bayesian methods, and everything beyond.
The community is the asset: when a new statistical method appears, the R package follows quickly, and Stack Overflow answers nearly every question. RStudio (now Posit) provides an excellent development environment, and R Markdown makes analyses reproducible and shareable.
Programming is required; there is no menu-driven fallback worth using. The learning curve is real for non-programmers. But for anyone doing serious statistical work regularly, R's combination of free, complete, and current is unmatched.
What we like- Free and open source
- The most complete statistical library
- Huge community
Watch out for- Learning curve
- Programming required
Starting priceFree
Free planYes
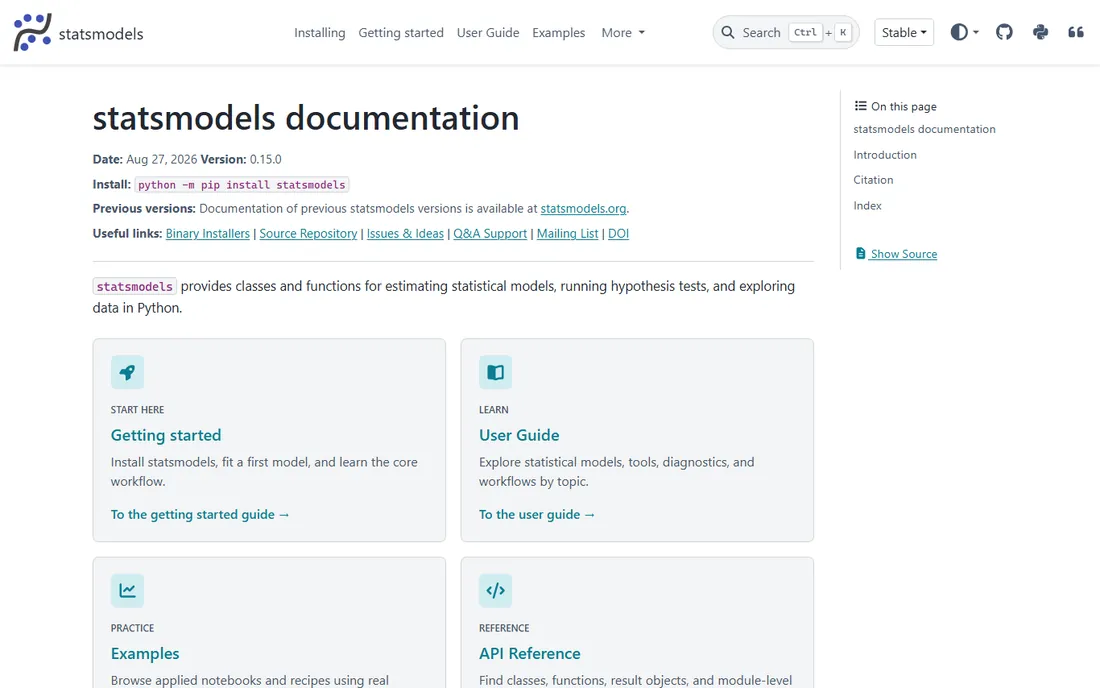
statsmodels brings R-style statistical modeling to Python: regression, time series, and hypothesis tests with the detailed summary output statisticians expect. For Python users, it fills the gap between pandas data manipulation and scikit-learn's machine learning focus.
The summary tables, coefficients, p-values, confidence intervals, diagnostics, mirror what R and SPSS produce, making results familiar to statistically trained readers. Integration with the Python data ecosystem (pandas, NumPy, Jupyter) keeps workflows smooth.
R's package ecosystem remains broader for the newest methods. But teams standardized on Python who need proper statistical inference, not just prediction, find statsmodels the natural choice.
What we like- Free
- Detailed statistical output
- Integrates with Python data stack
Watch out for- Less comprehensive than R
- Python required
Starting priceSee website
Free planNo
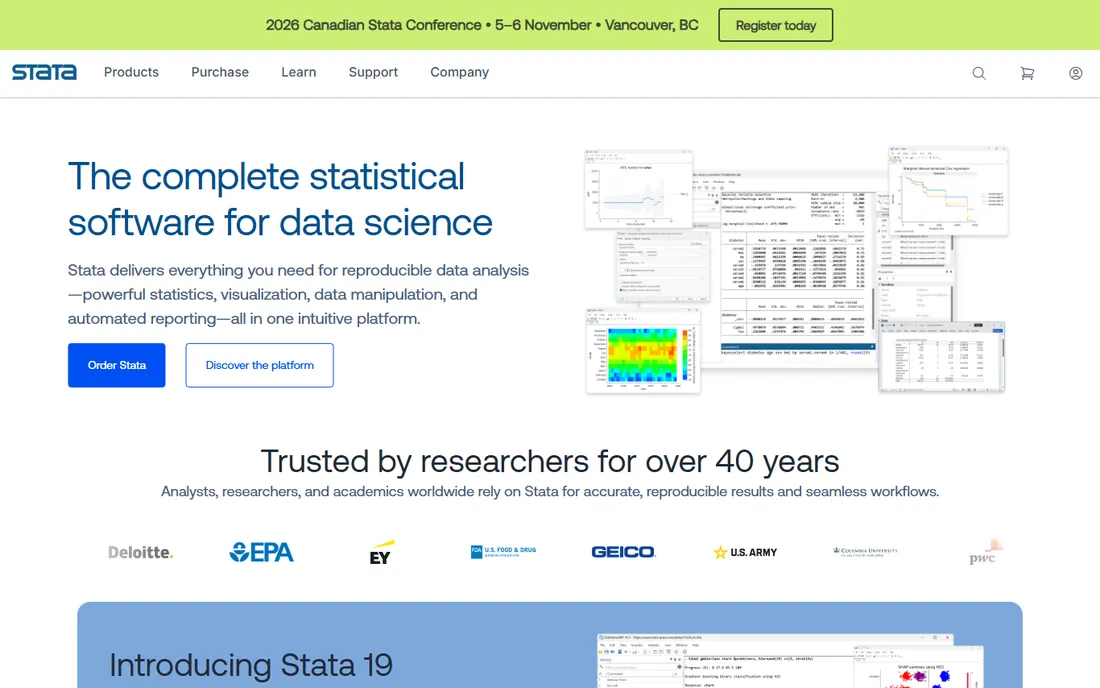
Stata is the econometrician's tool: labor economists, development researchers, and policy analysts run regressions on panel data through its command-driven interface. The do-file system makes analyses reproducible by default, which academia values.
Panel data, instrumental variables, and difference-in-differences, the workhorses of applied microeconomics, are first-class citizens. Documentation is excellent, with manuals that teach the methods alongside the commands.
Licensing costs real money, and the community is smaller than R's or Python's. But in economics departments and policy research, Stata's workflow and credibility keep it standard despite free alternatives.
What we like- Beloved by economists
- Reproducible do-files
- Excellent panel data support
Watch out for- Expensive
- Smaller community than R/Python
Starting priceSee website
Free planFree trial
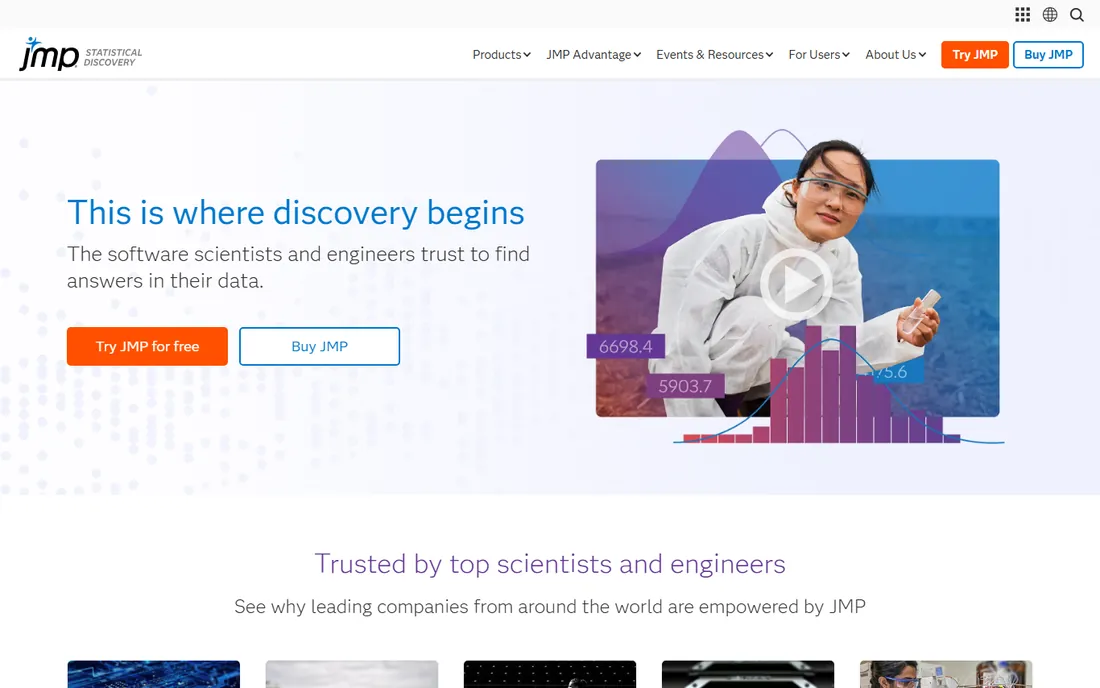
JMP (from SAS) makes statistics visual and interactive: drag variables, watch plots update live, and explore data in ways that static output cannot match. Engineers and scientists who think visually find it revelatory.
The design of experiments features are outstanding, serving R&D and manufacturing users who optimize processes. Regression tools are capable, with the interactive diagnostics helping users understand model fit intuitively.
Pricing follows the SAS tradition: serious money. But for organizations where visual exploration drives insight and the users are scientists rather than programmers, JMP's interactivity justifies the cost.
What we like- Beautiful interactive graphics
- Great for exploration
- Strong DOE
Watch out for- Expensive
- SAS ecosystem pricing
Starting priceSee website
Free planFree trial
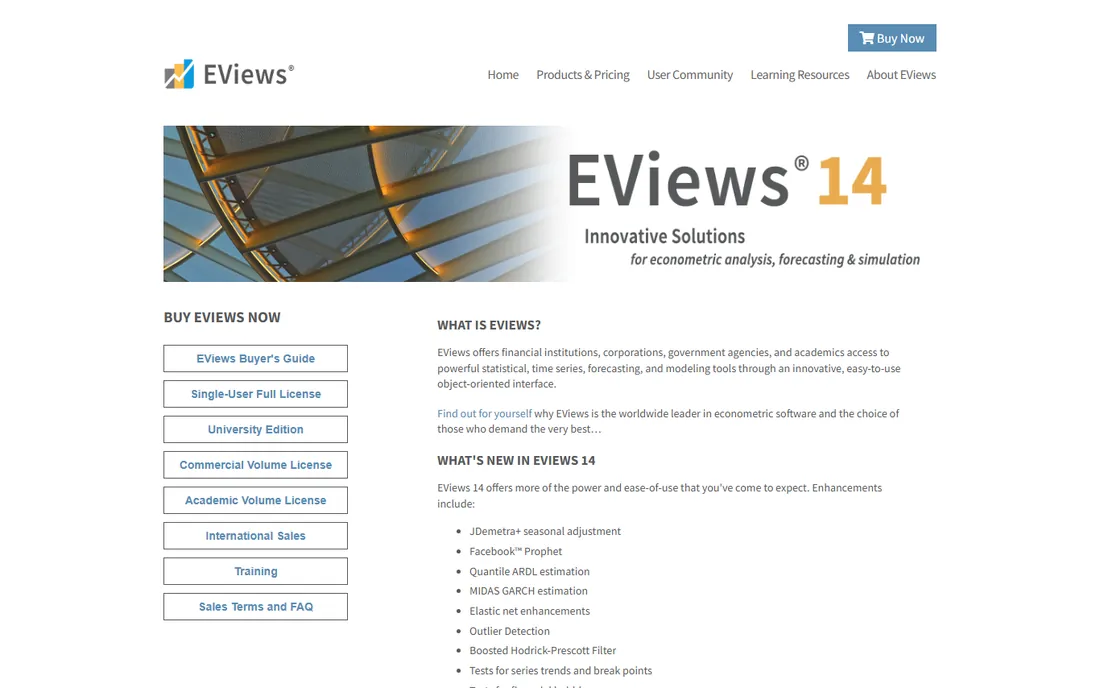
EViews is built for time-series econometrics: ARIMA models, cointegration, VAR, GARCH, and forecasting workflows that economists and financial analysts use daily. The object-oriented interface organizes series, equations, and models intuitively.
Forecasting features go beyond estimation: scenario analysis, model solution, and presentation-quality output serve central banks, finance ministries, and corporate economists. The learning curve is gentle for the target audience.
General statistics outside time series are thinner than competitors'. But for the specific world of economic time series, EViews' focused depth beats generalist tools.
What we like- The time-series specialist
- Excellent forecasting
- Intuitive for economists
Watch out for- Niche focus
- Less general than competitors
Starting priceSee website
Free planFree trial
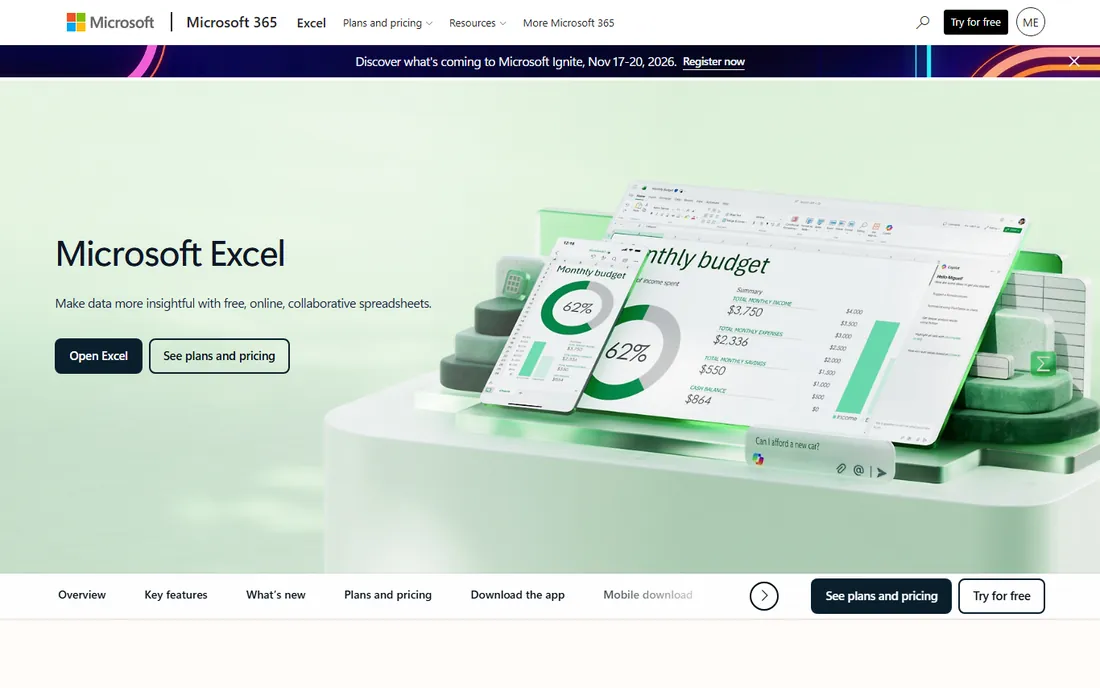
Excel's Data Analysis Toolpak runs multiple regression in seconds, and for simple models with clean data, that is genuinely enough. Every analyst already has it, every manager can open the file, and the learning curve is zero.
The honest limits are real: no logistic regression in the Toolpak, weak diagnostics, and the error-prone nature of spreadsheet modeling for anything complex. Serious statistical work belongs in serious tools.
But dismissing Excel misses its role: quick exploratory regressions, communicating results to non-technical audiences, and teaching concepts. Use it for what it is, and graduate to proper tools when the analysis demands.
What we like- Already everywhere
- Quick for simple models
- Everyone can read output
Watch out for- Limited methods
- Error-prone for serious work
Choosing by user, not by feature
The right regression tool depends on who is analyzing. Non-programmer professionals in industry: Minitab or JMP. Academic researchers: SPSS or Stata, depending on field. Programmers doing statistics: R or Python with statsmodels. Quick business analysis: Excel.
Field norms matter enormously. Publishing in economics without Stata or R raises eyebrows; quality engineering without Minitab confuses colleagues. The tool your community uses is usually the right tool, because shared tools mean shared help.
Budget constraints point to the free options, which are also the most powerful. R and Python cost nothing and do everything. The paid tools earn their prices through guidance, support, and workflow fit, not statistical superiority.
Reproducibility: the professional standard
Whatever tool you choose, make analyses reproducible. Code-based tools (R, Python, Stata do-files, SPSS syntax) record exactly what was done. Menu-driven analyses should be supplemented with saved syntax or detailed logs.
The standard is simple: someone else should be able to rerun your analysis and get your numbers. That discipline catches errors, enables collaboration, and satisfies the growing reproducibility requirements in research and regulated industries.
Version control your analysis code, document data sources, and note software versions. These habits matter more than which tool you pick.
From analysis to decision
Regression output is not the deliverable; the decision it informs is. Present findings in the language of the decision: what changes, by how much, with what uncertainty. Coefficients and p-values belong in appendices; clear conclusions belong up front.
Visualize the key relationships. A well-chosen plot communicates a regression result faster than any table. Show the fitted relationship, the uncertainty around it, and the practical implication. Decision-makers remember pictures, not statistics.
Quantify uncertainty honestly. Confidence intervals and prediction intervals tell the audience how much to trust the estimate. Analyses that hide uncertainty invite overconfidence; those that show it enable better-calibrated decisions.
Common regression mistakes
The most common mistake is confusing correlation with causation. Regression shows association; causal claims need experimental or quasi-experimental design. Present observational findings carefully, with the limitations stated plainly.
Overfitting is the technical trap: complex models that fit the sample beautifully and predict new data terribly. Validate on held-out data, prefer simpler models, and distrust R-squared values that seem too good.
Ignoring assumptions is the silent killer. Non-linear relationships forced into linear models, heteroscedasticity unaddressed, influential outliers unexamined, all produce confident wrong answers. Run the diagnostics every time; they exist because the assumptions fail regularly.
How we chose
We compared software used for regression analysis across industry, academia, and data science, based on documentation, community adoption, and practitioner discussion. We covered menu-driven packages, programming environments, specialized econometrics tools, and the ubiquitous spreadsheet, because regression users span all of these. Pricing is typically license-based, so we link to vendors for current numbers.
Frequently asked questions
Which is better for regression: R or Python?
Both excel. R has the broader statistical package ecosystem and more elegant modeling syntax. Python integrates better with production systems and machine learning workflows. Statisticians lean R; data scientists in industry lean Python. Learn the one your field uses.
Can Excel handle multiple regression?
Yes, for simple cases via the Data Analysis Toolpak. It estimates coefficients and provides basic statistics. For diagnostics, logistic regression, or anything beyond straightforward linear models, move to proper statistical software.
Do I need to learn programming for regression analysis?
Not necessarily; Minitab, SPSS, JMP, and EViews all work through menus. But programming (R or Python) pays off quickly in reproducibility, flexibility, and career value. The menu tools are fine starting points that many professionals never outgrow.
What is the difference between regression and machine learning?
Regression estimates relationships between variables with statistical inference (coefficients, p-values, confidence intervals). Machine learning prioritizes prediction accuracy, often sacrificing interpretability. statsmodels and R serve the former; scikit-learn serves the latter. Many analysts use both.
How do I know if my regression model is valid?
Check the assumptions: linearity, independent errors, constant variance, and approximately normal residuals. Plot residuals, examine influence diagnostics, and validate on held-out data. The tools here all provide diagnostics; learning to read them is the real skill.
How do I choose between R and SPSS for my thesis?
Follow your department's norms and your advisor's expertise. The tool your committee knows is the right tool; statistical capability is rarely the deciding factor in academic work.
Can I do regression in Python without statsmodels?
Yes, with scikit-learn for prediction-focused modeling, but you lose the detailed statistical inference output. Use statsmodels when you need coefficients, p-values, and diagnostics; scikit-learn when prediction accuracy is the goal.
Sources we checked (8)
- https://www.minitab.com/en-us/
- https://www.ibm.com/products/spss-statistics
- https://www.r-project.org/
- https://www.statsmodels.org/
- https://www.stata.com/
- https://www.jmp.com/en/home
- https://www.eviews.com/
- https://www.microsoft.com/en-us/microsoft-365/excel
Is your product missing or out of date?
We review this list regularly. Vendors can request a listing, send updated pricing or ask about featured placement.

Shihab Mia · Founder, Rankite
Shihab has spent more than a decade helping SaaS and e-commerce brands grow through search. He writes Rankite's software buying guides from pricing pages, documentation and public user reviews. More about Shihab.