How we make this list: we compare pricing pages, product documentation and public user reviews. Rankite is independent; if a vendor ever pays for a featured spot, that listing is clearly labeled Partner.
Key takeaways
- Microsoft Power BI Pro ($14/user/month) and Tableau Creator ($75/user/month) lead general BI; Power BI for Microsoft shops, Tableau for design-led multi-cloud analysis.
- Qlik Sense ($30/user/month) suits vendor-neutral associative analytics; Zoho Analytics ($24/month) is the budget BI with a real free tier.
- Datarails, Vena, Jirav and Mosaic are the FP&A specialists for planning, budgeting and forecasting; all are quote-based enterprise sales.
- Fathom ($44/month) and Float ($59/month) serve small businesses with reporting and cash flow forecasting that accountants actually use.
- The top financial analysis software for you depends on the job: dashboards, planning or cash forecasting are different purchases.
Quick comparison
| Tool | Best for | Starting price | Free plan |
|---|
 Microsoft Power BI Microsoft Power BI | Microsoft shops | $14 per user/month (Pro) | Yes |
 Tableau Tableau | Design-led multi-cloud analysis | $75 per user/month (Creator) | Free trial |
 Qlik Sense Qlik Sense | Vendor-neutral associative analytics | $30 per user/month | Free trial |
 Zoho Analytics Zoho Analytics | Budget BI with a free tier | $24 per month (billed annually) | Yes |
 Datarails Datarails | Excel-based FP&A automation | See website | No |
 Vena Vena | Enterprise planning on Excel | See website | No |
 Jirav Jirav | Mid-market budgeting and forecasting | See website | No |
 Mosaic Mosaic | Strategic finance for startups | See website | No |
 Fathom Fathom | Management reporting for SMBs | $44 per month (Starter) | Free trial |
 Float Float | Cash flow forecasting | $59 per month | Free trial |
Is your product missing or out of date?
We review this list regularly. Vendors can request a listing, send updated pricing or ask about featured placement.
The best financial analytics software
The cost of the wrong financial analytics software is decided in the months you cannot see coming. A forecast built on stale spreadsheets misses the cash crunch by six weeks. A board pack assembled manually every month eats two weeks of your analyst's time and still contains last month's numbers. Ninety-six percent of finance professionals still use Excel as their primary planning tool, which tells you the existing solutions keep falling short on usability.
The second cost is buying the wrong category. BI dashboards, FP&A planning platforms and cash flow forecasters solve different problems, and vendors blur the lines deliberately. A company that needs rolling forecasts buys Tableau and discovers it does not do driver-based planning. A company that needs dashboards buys an FP&A suite and drowns in implementation. Name the job before you shop.
This list covers ten financial analytics tools that exist today, split across BI platforms, FP&A suites and small-business forecasting.
Starting price$14 per user/month (Pro)
Free planYes
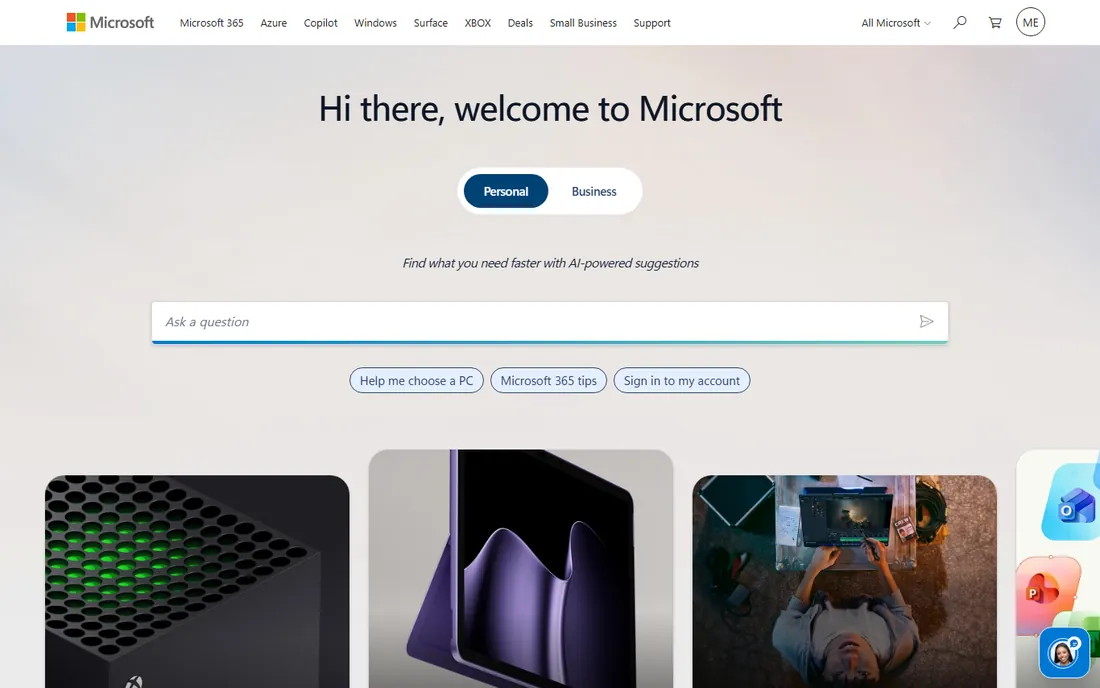
Power BI Pro at $14 a user a month is the value leader in BI: dashboards, sharing and collaboration for roughly a fifth of Tableau's per-user cost, with deep integration into Excel, Teams, Azure and Microsoft Fabric. The free tier covers building reports for personal use; sharing requires Pro. For the 70 percent of mid-market companies anchored on Microsoft 365, it is the default answer.
Total cost of ownership narrows the gap at enterprise scale, where Premium capacity starts around $5,000 a month and Fabric licensing enters. Authoring on macOS remains limited. Buy Power BI when your data and your users already live in Microsoft's world; the economics are overwhelming there.
What we like- Roughly 5x cheaper per user than Tableau
- Native Microsoft 365 and Fabric integration
- Mature Copilot AI features
Watch out for- Enterprise scale needs Premium capacity ($5,000+/month)
- Desktop authoring is Windows-only
- DAX has a learning curve
Starting price$75 per user/month (Creator)
Free planFree trial
Tableau remains the analyst's favorite for exploratory visualization: fluid drag-and-drop, complex chart types and a canvas that rewards skilled users. Creator runs $75 a user a month on Tableau Cloud Standard ($115 on Enterprise), with Viewer seats at $15 for dashboard readers. For multi-cloud or AWS and GCP-anchored estates, it is the natural fit.
The license math hurts at scale: a 500-user deployment can exceed Tableau's cost by $350,000 a year versus Power BI. Governance and enterprise deployment need more care. Choose Tableau when visual sophistication and analyst productivity justify the premium, not when standardized reporting would do.
What we like- Best-in-class visual exploration
- Strong for non-Microsoft data estates
- Viewer seats at $15 for readers
Watch out for- Creator at $75 is expensive at scale
- Governance maturity trails Power BI
- No unified data platform equivalent
#3
Qlik Sense
Best for: Vendor-neutral associative analytics
Visit qlik.com
Starting price$30 per user/month
Free planFree trial

Qlik Sense's associative engine is its differentiator: it shows not just selected data but what is excluded, revealing relationships other tools hide. At around $30 a user a month for SaaS, it sits between Power BI and Tableau on price, with broad connectors and a vendor-neutral stance that suits mixed estates. Complex associative analysis is genuinely powerful here.
The learning curve is real, and the community and third-party resources are smaller than Power BI's. The interface does not match Tableau's polish. Pick Qlik when your analysis needs associative exploration across complex data relationships and you want no vendor lock-in.
What we like- Associative engine reveals hidden relationships
- Broad connector library
- Vendor-neutral positioning
Watch out for- Steeper learning curve
- Smaller community than Power BI
- Interface less polished than Tableau
Starting price$24 per month (billed annually)
Free planYes
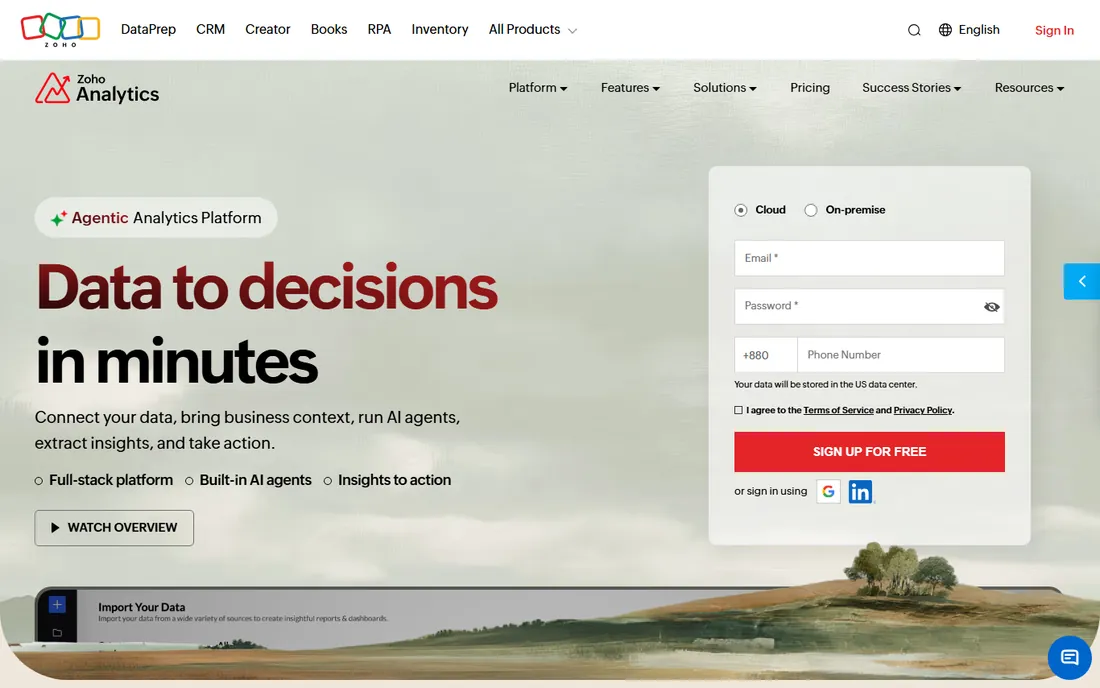
Zoho Analytics Basic at $24 a month billed annually covers 2 users and half a million rows, with a free plan for 2 users and 10,000 rows. For small businesses that need real dashboards without real budgets, nothing else comes close on price. The connector library is broad and the spreadsheet-like interface suits Excel graduates.
Expect trade-offs: visualization sophistication and performance trail the leaders, and the row-based pricing means growing data volumes push you up tiers. For cost-led buyers and Zoho ecosystem users, it is the pragmatic choice.
What we like- Cheapest real BI on this list
- Free plan for 2 users
- 250+ connectors on paid plans
Watch out for- Visualization polish trails Tableau
- Priced by rows and users
- Advanced features on higher tiers
Starting priceSee website
Free planNo
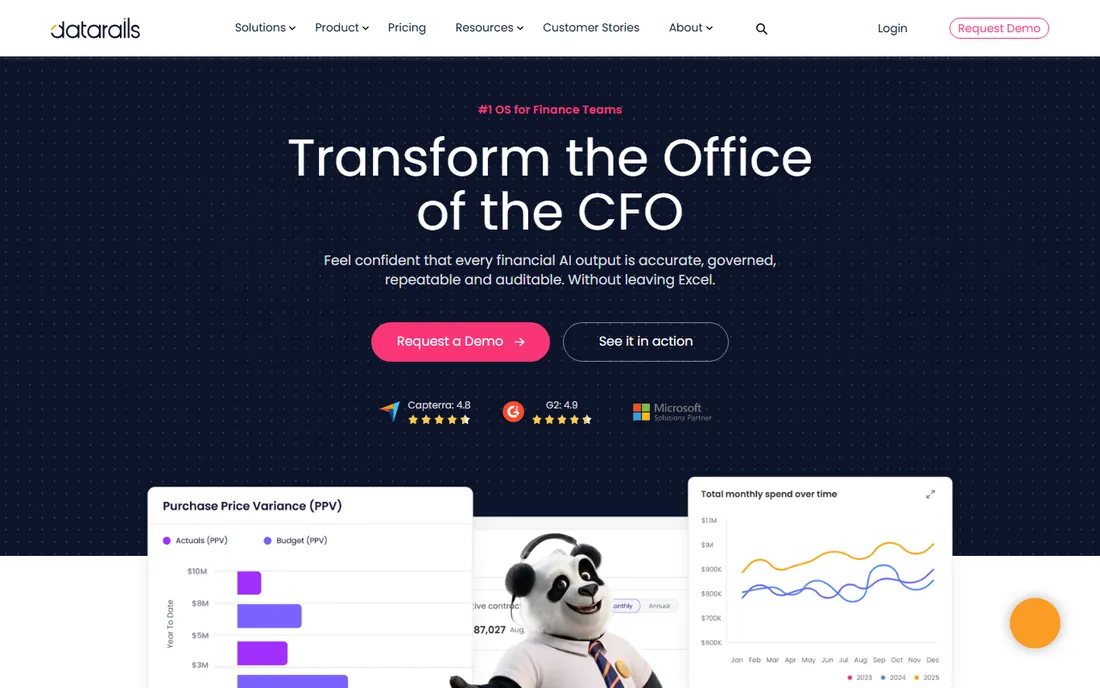
Datarails automates FP&A without asking finance teams to abandon Excel: it connects spreadsheets to a central database, automating consolidation, variance analysis and reporting while analysts keep working in the interface they know. AI-driven forecasting and audit trails serve mid-market finance teams drowning in spreadsheet chaos.
Pricing is quote-based and implementations take real effort; the "keep Excel" pitch still requires process change. For finance teams that refuse to leave spreadsheets but need them governed, it is the most credible option.
What we like- Keeps Excel as the interface
- Automates consolidation and reporting
- Strong audit trails
Watch out for- Quote-only pricing
- Implementation effort significant
- Excel dependence limits advanced modeling
Starting priceSee website
Free planNo
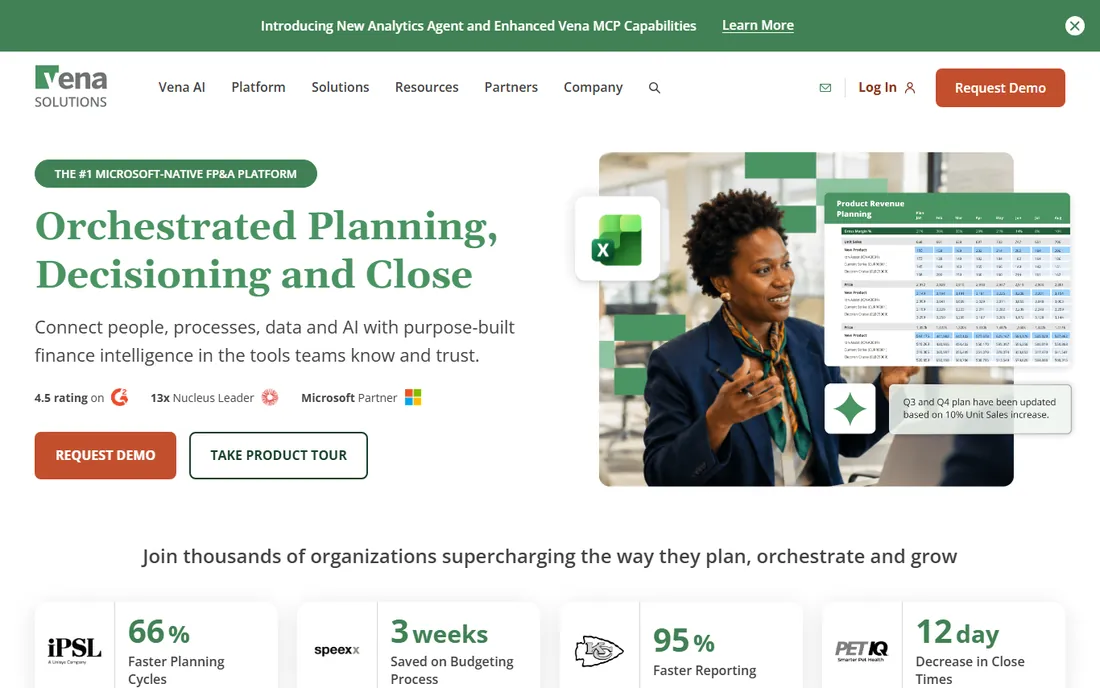
Vena is the enterprise-grade planning platform that lives inside Excel: budgeting, forecasting, workforce planning and financial close with workflows, approvals and audit controls. It suits mid-market and enterprise finance teams that want planning discipline without retraining everyone off spreadsheets. First-year totals with onboarding often run well into five figures.
The Excel interface is both the strength and the ceiling: power users eventually want more than spreadsheets allow. Buy Vena when your planning process needs enterprise governance and your team will not leave Excel.
What we like- Full planning platform with Excel interface
- Strong workflow and approvals
- Proven at enterprise scale
Watch out for- Quote-only pricing
- Onboarding fees significant
- Needs dedicated finance systems ownership
Starting priceSee website
Free planNo
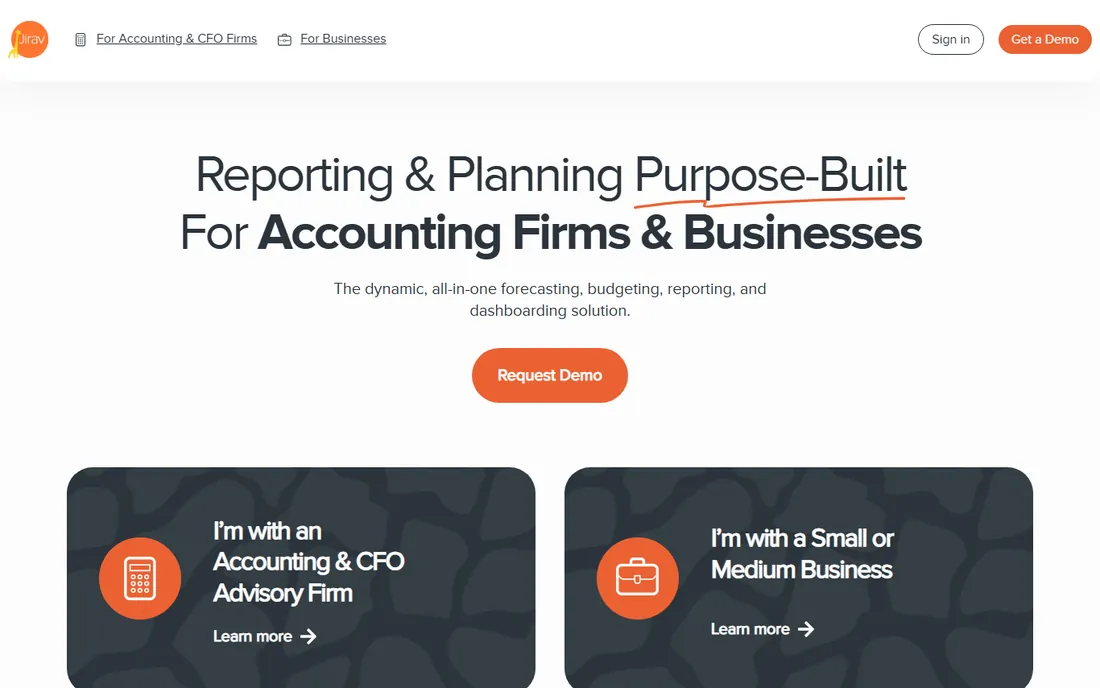
Jirav connects accounting, headcount and sales data for budgeting, forecasting and reporting aimed at mid-market companies: plan versus actuals, rolling forecasts and driver-based models with best-practice templates. Integrations with QuickBooks, Xero, NetSuite and Gusto cover the typical growth-company stack.
Pricing is quote-based and the platform is more than a small business needs; very small companies should look at Fathom or Float instead. Like all FP&A tools, it is only as good as the source data. For growing companies outgrowing spreadsheet planning, it is a natural step up.
What we like- Purpose-built FP&A for growing companies
- Plan vs actuals and rolling forecasts
- Good accounting integrations
Watch out for- Quote-based pricing
- Overkill for very small businesses
- Needs clean source data to shine
Starting priceSee website
Free planNo
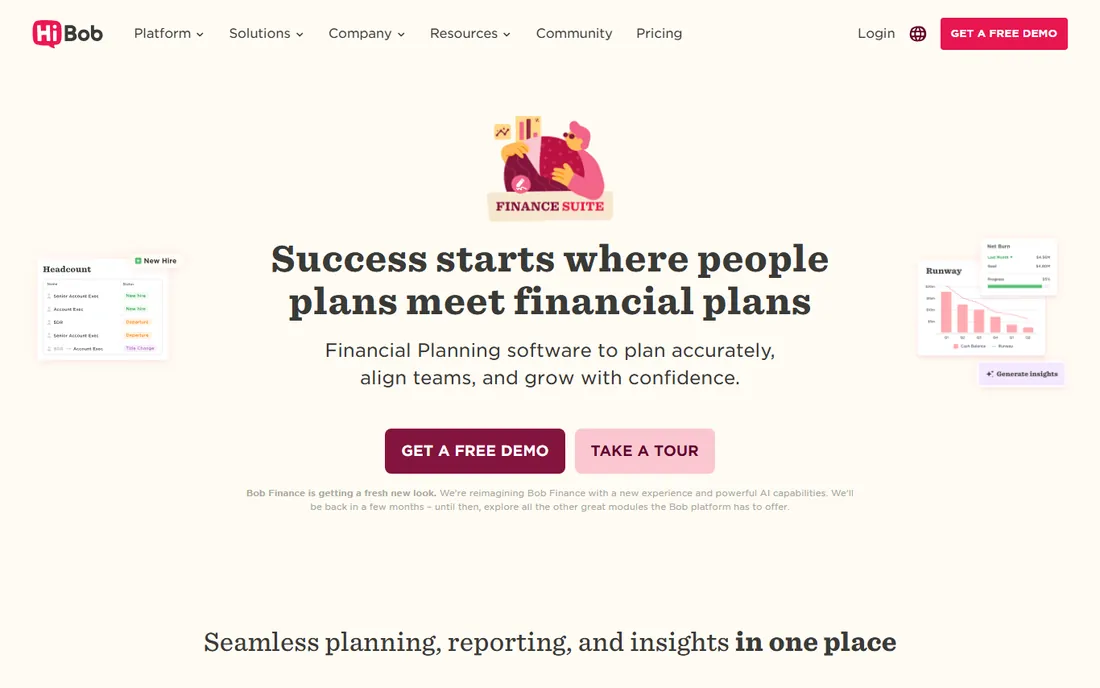
Mosaic is the strategic finance platform for startups and tech companies: real-time metrics, headcount planning and board-ready dashboards that speak the language of SaaS finance. It targets finance teams that need to move fast without building planning infrastructure from scratch. Time to value is a genuine strength.
The focus is narrow by design: SaaS and startup metrics first, general FP&A second. Pricing is quote-based. If you are a funded startup building a finance function, Mosaic fits the stage; mature enterprises need the broader suites above.
What we like- Built for startup and SaaS metrics
- Strategic planning dashboards
- Fast time to value
Watch out for- Quote-only pricing
- SaaS-startup focus limits general use
- Younger vendor
Starting price$44 per month (Starter)
Free planFree trial
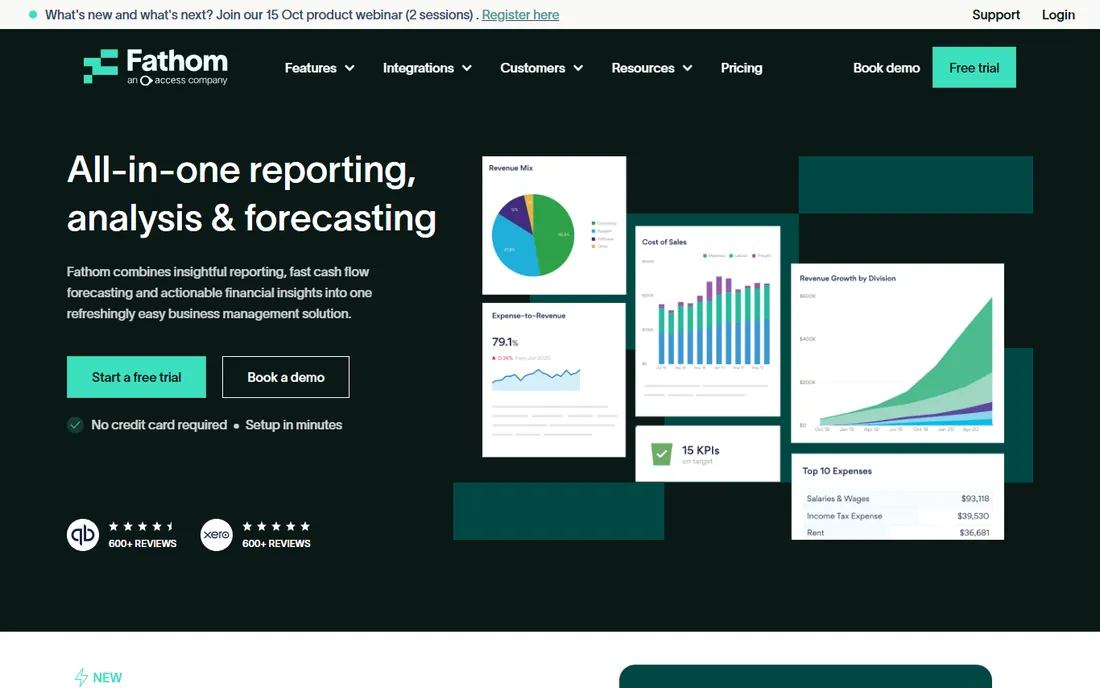
Fathom turns accounting data into management reports, KPI dashboards and cash flow forecasts that clients actually read: Starter at $44 a month, scaling through Silver, Gold and Platinum as entities and features grow. Accountants use it to deliver advisory services; business owners get visual financial insight without analyst skills.
It is reporting and analysis, not full FP&A planning; driver-based budgeting lives elsewhere. The accountant-centric design can feel indirect for owner-operators. For SMB reporting that looks professional and arrives on schedule, it is the standard.
What we like- Beautiful automated management reports
- KPI tracking and benchmarking
- Integrates with Xero and QuickBooks
Watch out for- Accountant-centric workflow
- Analysis depth below FP&A suites
- Pricing climbs with entities
Starting price$59 per month
Free planFree trial
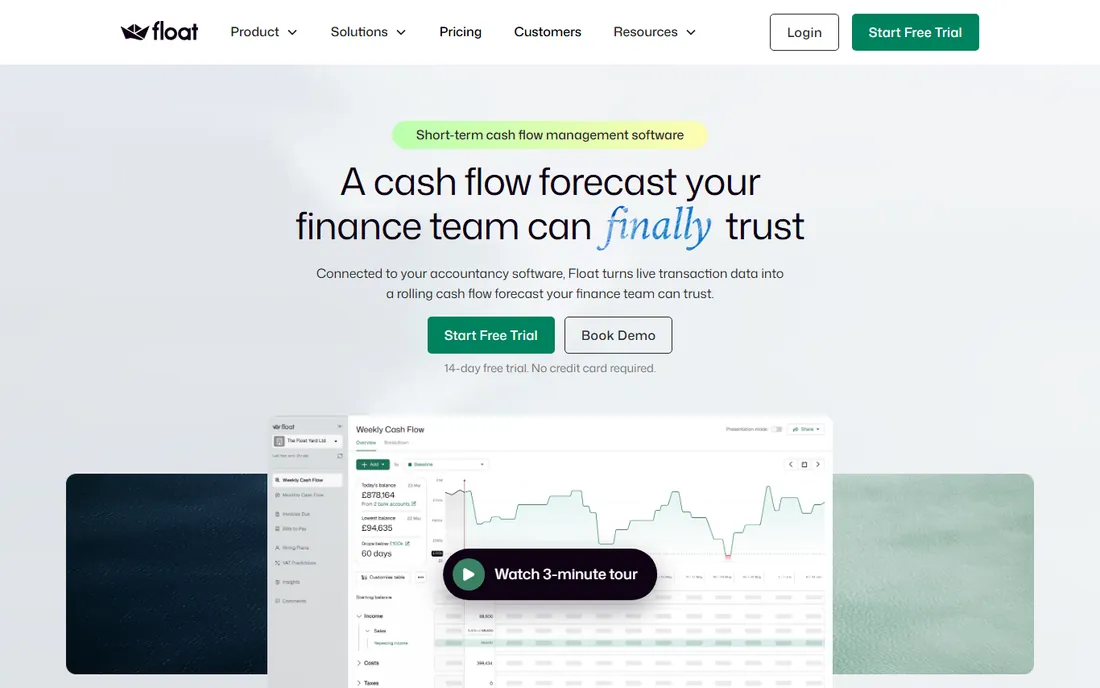
Float does one thing well: cash flow forecasting. Thirteen-week rolling forecasts built from your accounting data, with scenario modeling for the what-ifs, starting at $59 a month and set up in hours. For businesses where cash is the existential question, which is most small businesses, the focus is the feature.
It does not do broader financial planning, and multi-entity businesses pay more. Pair it with Fathom for reporting or an FP&A tool for planning. When the question is "will we make payroll in March," Float answers it.
What we like- Cash-first 13-week rolling forecasts
- Integrates with Xero, QuickBooks and Sage
- Fast setup
Watch out for- Narrow scope beyond cash
- Scenario depth below FP&A tools
- Per-entity pricing adds up
How this shortlist was assembled
This list was built from vendor pricing pages, feature documentation and public reviews checked in October 2026, covering BI platforms, FP&A suites and small-business forecasting tools. Only products available today were included. Quote-only enterprise products are marked as such. No hands-on testing was performed and no vendor paid for placement.
What to check before you commit
Name the job first: dashboards, planning or cash forecasting. BI tools answer "what happened and what is happening." FP&A suites answer "what should we plan for." Cash tools answer "can we pay our bills." Buying across categories wastes money; most companies need one category urgently and the others eventually.
Then audit your data. Every tool on this list is only as good as the accounting and operational data feeding it. Messy charts of accounts, unreconciled books and spreadsheet shadow systems will produce expensive, pretty wrong answers. Fix the source data before the analytics purchase, not after.
Total cost beyond licenses
FP&A implementations carry onboarding fees from $5,000 to $25,000, and enterprise BI needs capacity licensing at scale. Model the first-year total including implementation, training and the internal staff time. A $14-a-user BI tool with a $5,000-a-month capacity requirement is not a $14 tool.
Who will own it
Analytics tools die without owners. Assign the person who maintains data connections, builds the core dashboards or models, and trains users before you sign. A named owner with weekly hours beats a bigger budget with no accountability.
The spreadsheet trap
The reason 96 percent of finance professionals still plan in Excel is not ignorance; it is that Excel does everything badly but nothing impossibly. Every analytics purchase competes with the spreadsheet's flexibility, and tools that demand rigid processes lose to the grid. The winners meet finance teams halfway: Datarails and Vena keep Excel as the interface, Power BI and Tableau connect to Excel data, and Float and Fathom automate what spreadsheets do worst.
Plan your migration as coexistence, not replacement. Run the new tool alongside the spreadsheet for one full planning cycle, reconcile the outputs, and retire the spreadsheet only when the team trusts the replacement. Ripping out Excel on day one is how analytics projects fail.
Frequently asked questions
What is financial analytics software?
Software that analyzes financial data to support decisions: dashboards and BI for reporting what happened, FP&A platforms for budgeting and forecasting what will happen, and cash flow tools for tracking liquidity. The category spans all three, and the right choice depends on which question you need answered.
How much does financial analytics software cost?
From $24 a month (Zoho Analytics) to $14 a user a month (Power BI Pro) to $75 a user a month (Tableau Creator), with FP&A suites quote-based and first-year totals often reaching five figures including onboarding. Small-business tools like Fathom ($44/month) and Float ($59/month) sit in the middle.
What is the difference between BI and FP&A software?
BI (Power BI, Tableau, Qlik) visualizes and explores data to report what happened. FP&A (Datarails, Vena, Jirav, Mosaic) plans and forecasts: budgets, driver-based models, rolling forecasts and variance analysis. Companies typically need BI for reporting and FP&A for planning; they are complementary, not substitutes.
Can small businesses do financial analytics without an FP&A team?
Yes. Fathom automates management reporting from your accounting data, Float handles cash flow forecasting, and Zoho Analytics or Power BI cover dashboards. These tools are built for businesses without analysts. Full FP&A suites only make sense once planning complexity exceeds what these can handle.
Is Excel still relevant for financial planning?
Enormously. Nearly all finance professionals still use Excel, and tools like Datarails and Vena are built around it. Excel's flexibility keeps it central; the analytics tools add governance, automation and scale around it. The realistic goal is governed Excel, not Excel elimination.
How long does FP&A software implementation take?
Small-business tools like Float deploy in hours. Mid-market FP&A like Jirav takes weeks. Enterprise suites like Vena and Datarails typically take one to three months including data integration, model building and training. The timeline depends on data cleanliness more than software complexity.
Sources we checked (11)
- https://thinklytics.com/insights/tableau-vs-power-bi-2026
- https://stackrundown.com/power-bi-vs-tableau-key-differences/
- https://www.neenopal.com/blog/Things-you-need-to-know-about-PowerBI
- https://diffstudy.com/power-bi-vs-tableau-vs-looker/
- https://beyondtheanalytics.com/blog/tableau-vs-power-bi-features-comparison-2026
- https://www.spotsaas.com/product/zoho-analytics--zoho-reports-/pricing
- https://comparisons.financesonline.com/sisense-vs-zoho-analytics-vs-pyramid-analytics
- https://www.itqlick.com/jirav/pricing
- https://clarivian.io/blog/cash-flow-forecasting-software-smes
- https://www.trustradius.com/compare-products/float-resource-management-vs-the-access-group-fathom
- http://powerdrill.ai/blog/10-best-cash-flow-forecasting-tools-in-2026
Is your product missing or out of date?
We review this list regularly. Vendors can request a listing, send updated pricing or ask about featured placement.

Shihab Mia · Founder, Rankite
Shihab has spent more than a decade helping SaaS and e-commerce brands grow through search. He writes Rankite's software buying guides from pricing pages, documentation and public user reviews. More about Shihab.