How we make this list: we compare pricing pages, product documentation and public user reviews. Ratings come from G2, Capterra or Trustpilot, with the date we checked them.
What is data visualization software for nonprofits
Data visualization software for nonprofits turns program, donor, and finance data into charts, maps, and dashboards that boards, funders, and the public can actually read. A nonprofit does not visualize data for its own sake. It shows donors where the money went, shows a board whether a program hit its targets, and shows a grantmaker the outcomes the grant paid for.
The tools in this guide serve two different jobs. Publishing tools such as Datawrapper, Flourish, and Infogram make clean, embeddable charts and maps for annual reports, websites, and social media, with no BI infrastructure behind them. BI platforms such as Tableau, Power BI, Metabase, and Zoho Analytics connect to the donor database and the accounting system and build the dashboards the leadership team reviews every month. Looker Studio sits between the two: free, easy, and good enough for most small nonprofits. The right choice depends on whether the audience is the public or the board, and on whether the data lives in spreadsheets or in a database.
Start with the audience and the budget. A small nonprofit that publishes an annual report and a few social posts needs a publishing tool with a free tier, not an enterprise BI platform. A larger nonprofit that reports to a board and several grantmakers needs dashboards that refresh from the donor database, which points to a BI platform. Nonprofit discounts change the math a lot: Datawrapper gives nonprofits 20 percent off paid plans, Tableau offers discounted licences through TechSoup, and Microsoft for Nonprofits discounts Power BI, so always ask for the nonprofit price before comparing list prices.
Next, check who will build the charts. If the communications officer builds them, the tool must work from a spreadsheet with no code. Datawrapper, Flourish, Infogram, and Looker Studio all meet that test. If a data analyst builds them, a BI platform with SQL and a semantic layer is worth the learning curve. Check the sharing model too. Public charts need embedding and accessibility, while board dashboards need permissions and scheduled email delivery. Finally, confirm the free plan is usable. Several free plans watermark every chart or publish it publicly, which is fine for a public report and wrong for a confidential board pack.
What does data visualization software cost for nonprofits in 2026
Pricing runs from free to several hundred dollars a month, and the nonprofit discounts are the first thing to check. Looker Studio is free with no seat limit, and self-hosted Metabase is free open source. Datawrapper is free for publishing charts with attribution, then Pro starts at $21 per user per month, with 20 percent off for nonprofits. Flourish is free for public visualizations, with paid plans from $69 per user per month billed annually according to third-party reads, though the figures conflict and should be confirmed on the vendor page. Infogram is free on Basic, then Pro starts at $19 a month and Business at $67 a month, according to third-party listings.
Per-user BI tools start at $14 per user per month for Power BI Pro and $15 per user per month for Tableau Viewer, before nonprofit discounts. Metabase Cloud starts at $100 a month for five users. Zoho Analytics does not publish paid prices on its homepage. The honest way to compare them is to price the whole team, including the nonprofit discount, and to check whether the free plan carries a watermark or publishes the chart publicly, because those limits decide whether the free tier is actually usable.
Quick comparison
| Tool | Best for | Starting price | Free plan |
|---|
 Google Looker Studio | Small nonprofits that want free dashboards from Google Sheets and Analytics | Free (checked 21 Nov 2026) | Yes, Looker Studio is free with no seat limit |
 Datawrapper | Nonprofits that publish charts, maps, and tables on their website and in reports | Free; Pro from $21 per user per month (checked 21 Nov 2026) | Yes, free plan with Datawrapper attribution on each chart |
 Flourish | Nonprofits that want animated, interactive data stories for the public | Free; paid from $69 per user per month, billed annually (third-party reads conflict, $63 to $999; checked 21 Nov 2026) | Yes, free plan for public visualizations with Flourish branding |
 Tableau | Nonprofits that want the deepest visual analytics and can use a nonprofit discount | Viewer from $15 per user per month; Creator about $75 per user per month (checked 21 Nov 2026) | Yes, Tableau Desktop is now free to download, and Tableau Public is free |
 Microsoft Power BI | Nonprofits already using Microsoft 365 that want dashboards at a nonprofit price | Free (Desktop); Pro from $14 per user per month (checked 21 Nov 2026) | Yes, Power BI Desktop is free |
 Metabase | Nonprofits with a technical volunteer or staffer that want open source dashboards | Free (self-hosted open source); Cloud from $100 per month (checked 21 Nov 2026) | Yes, the self-hosted open source edition is free |
 Zoho Analytics | Nonprofits already using Zoho apps that want full BI without the enterprise price | quote (paid prices not shown on the homepage; checked 21 Nov 2026) | No free plan; a 15-day free trial with no credit card is available |
 Infogram | Nonprofits that need polished infographics and charts for annual reports and social media | Free (Basic); Pro from $19 per month (third-party listing; checked 21 Nov 2026) | Yes, free Basic plan |
Is your product missing or out of date?
We review this list regularly. Vendors can request a listing, send updated pricing or ask about featured placement.
Starting priceFree (checked 21 Nov 2026)
Free planYes, Looker Studio is free with no seat limit
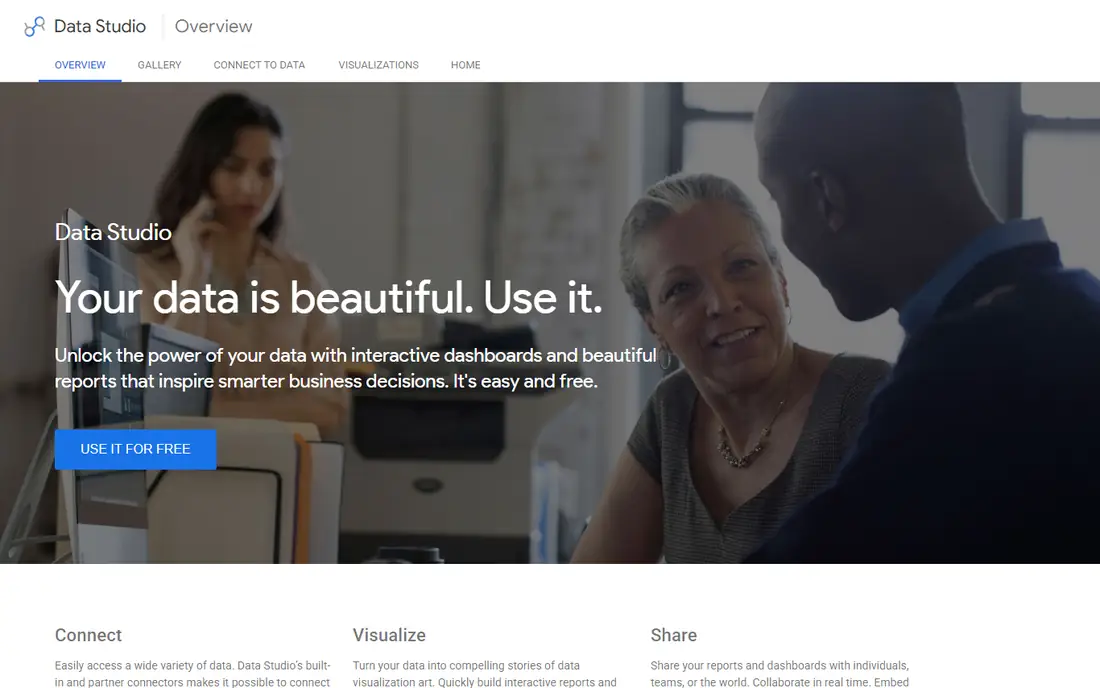
Looker Studio is Google's free dashboarding tool, and for a small nonprofit it is the cheapest way to get live charts. It connects natively to Google Analytics, BigQuery, and Google Sheets, and dashboards share with a link like a Google Doc. A nonprofit can build a donor dashboard, a program outcomes dashboard, and a website analytics report in a day, with no licence cost and no seat limit, which makes it easy to give every staff member and board member a view. Templates cover the common reports, and scheduled email delivery keeps the numbers in front of stakeholders. The catch is governance: there is no semantic layer, so two dashboards can define the same metric differently, and data blending is weaker than in paid BI tools. Support is community based, and a nonprofit that needs governed metrics should look at a paid BI platform instead.
What we like- Free with no seat limit, native Google Analytics and BigQuery connections, easy sharing with a link, large template gallery
Watch out for- No governed semantic layer, limited data blending compared with paid BI tools, and support is community based
#2Datawrapper
Best for: Nonprofits that publish charts, maps, and tables on their website and in reports4.3/5 on
G2 (10 reviews, checked Oct 2026)
Visit datawrapper.de
Starting priceFree; Pro from $21 per user per month (checked 21 Nov 2026)
Free planYes, free plan with Datawrapper attribution on each chart
Datawrapper is the quiet workhorse of data journalism, and it fits nonprofit communications the same way. It turns a pasted or uploaded table into a chart, map, or table that can be published and embedded on a website, with defaults so good they rarely need touching. The chart library covers 23 chart types, and published charts respond to hover and adapt to screen size. The free plan covers creating, publishing, and embedding with attribution, PNG download, and 30 days of edit history. Pro starts at $21 per user per month and adds PDF and SVG export, attribution removal, custom fields, and 90 days of edit history, while Business starts at $39 per user per month and adds waterfall and dual-axis charts, team permissions, and priority support. Nonprofits receive 20 percent off paid plans. The catch is the cloud model: charts live on Datawrapper servers, and custom styling needs the paid plans.
What we like- Best-in-class defaults and accessibility, first-class maps and tables, nonprofits get 20 percent off paid plans, free tier has no hard limits on publishing
Watch out for- Custom styling and team features sit on paid plans, charts are hosted on Datawrapper servers, and the free plan carries a "Created with Datawrapper" attribution
#3Flourish
Best for: Nonprofits that want animated, interactive data stories for the public4.7/5 on
G2 (3 reviews, checked Oct 2026)
Visit flourish.studio
Starting priceFree; paid from $69 per user per month, billed annually (third-party reads conflict, $63 to $999; checked 21 Nov 2026)
Free planYes, free plan for public visualizations with Flourish branding
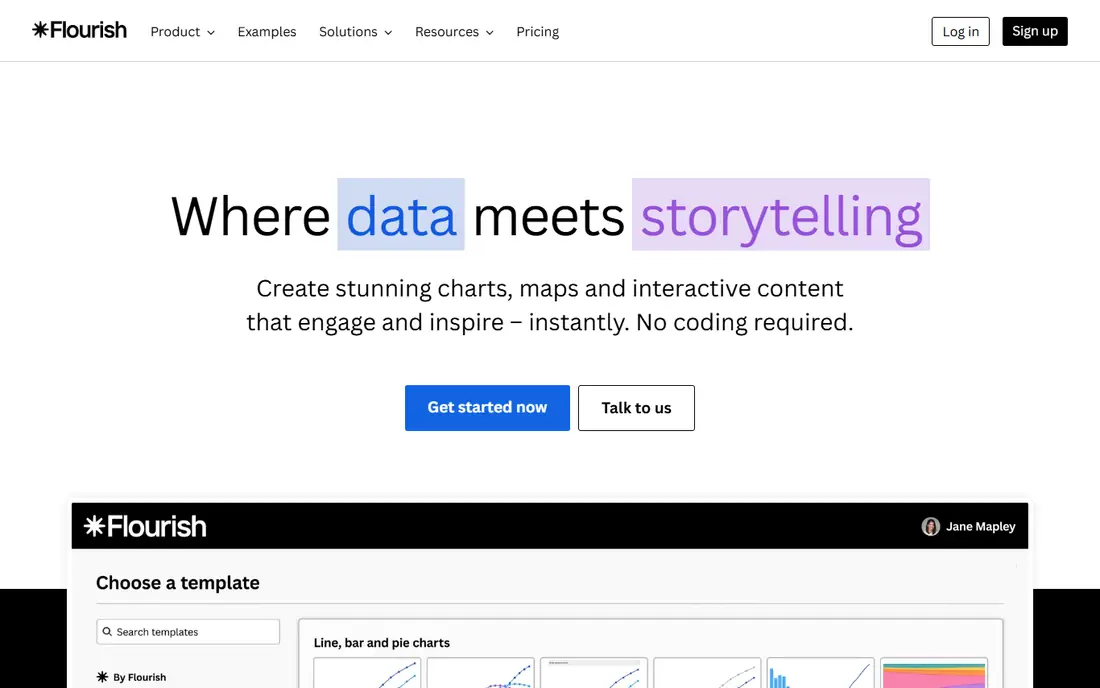
Flourish, now owned by Canva, specializes in interactive, animated data visualizations designed to be shared and embedded. It offers more than 50 visualization templates including race charts, scrollytelling narratives, interactive maps, and animated timelines designed to travel well on social media and in digital publications. A nonprofit can turn a spreadsheet of program outcomes into a story a donor actually reads, without a developer. The free plan covers unlimited projects with Flourish branding, but published work is public. Paid plans add private publishing, premium templates, and self-hosted embeds. The honest catch is the pricing: third-party listings disagree widely, from $63 to $999 a month, so the $69 per user per month figure used here should be confirmed on the vendor page before budgeting. Flourish also needs manual data uploads rather than live connected sources.
What we like- 50 plus animated and interactive templates, scrollytelling narratives, interactive maps and timelines, easy embedding and social sharing
Watch out for- Free plan requires public publishing with a watermark, paid prices vary widely across third-party listings, and the tool needs manual data uploads rather than live sources
#4Tableau
Best for: Nonprofits that want the deepest visual analytics and can use a nonprofit discount4.4/5 on
G2 (3,787 reviews, checked Oct 2026)
Visit tableau.com
Starting priceViewer from $15 per user per month; Creator about $75 per user per month (checked 21 Nov 2026)
Free planYes, Tableau Desktop is now free to download, and Tableau Public is free
Tableau remains the benchmark for visual analytics, and its pricing posture has softened in a buyer-friendly way: Tableau Desktop is now free to download, and the homepage pushes a free trial of the full platform. Drag-and-drop exploration turns raw tables into interactive dashboards fast, and the community, training, and extension ecosystem are the deepest in BI. Viewer licences start at $15 per user per month, while Creator licences for building run about $75. Most nonprofits need only a few Creator licences and more Viewers, which keeps costs manageable, and discounted licences are available through TechSoup, so the nonprofit price is lower than the list price shown here. The honest catch is that the free tier gets you building, but sharing at organizational scale runs on paid licences, and Tableau's real power rewards users who invest time learning it.
What we like- Best visual analytics, drag-and-drop exploration, huge community and learning resources, nonprofit licences available through TechSoup
Watch out for- Paid Cloud and Server pricing is quote-driven, and the full power takes training to master
#5Microsoft Power BI
Best for: Nonprofits already using Microsoft 365 that want dashboards at a nonprofit price4.5/5 on
G2 (1,661 reviews, checked Oct 2026)
Visit microsoft.com
Starting priceFree (Desktop); Pro from $14 per user per month (checked 21 Nov 2026)
Free planYes, Power BI Desktop is free
Power BI is the default choice for Microsoft-centric organizations, and the economics explain why: Power BI Desktop is free, Pro costs $14 per user per month billed annually, and the service layers into Microsoft 365 licensing many nonprofits already own at a discount through Microsoft for Nonprofits. It connects to and visualizes data from hundreds of sources, embeds into the apps teams use daily, and now sits as the BI layer of Microsoft Fabric. A nonprofit can build donor, program, and finance dashboards once and share them across the organization, with free training through Microsoft Learn. The platform's strength is breadth within the Microsoft ecosystem, plus embedded analytics for developers at pay-as-you-go rates. The honest catch is licensing complexity. Mixing Free, Pro, Premium per-user, and Fabric capacity SKUs confuses even experienced admins, and real collaboration beyond personal use requires paid licences.
What we like- Natural fit with Excel, Teams, and Azure, Power BI Desktop is free, part of Microsoft Fabric, discounted nonprofit pricing through Microsoft for Nonprofits
Watch out for- Licensing is famously complicated, and real collaboration beyond personal use requires paid licences
#6Metabase
Best for: Nonprofits with a technical volunteer or staffer that want open source dashboards4.4/5 on
G2 (147 reviews, checked Oct 2026)
Visit metabase.com
Starting priceFree (self-hosted open source); Cloud from $100 per month (checked 21 Nov 2026)
Free planYes, the self-hosted open source edition is free
Metabase is the rare BI tool developers genuinely recommend to each other: open source, free to self-host with a single Docker command, and simple enough that non-technical staff can build their own dashboards. The company says more than 100,000 teams use it. A nonprofit can connect its donor database or warehouse, define donation and program metrics once in the query builder, and share dashboards with staff and the board. Cloud Starter runs from $100 a month for five users. Recent releases add AI features on all plans, a semantic layer for trusted metrics, and embedded analytics for nonprofits that want to show public dashboards on their own website. The catch is the open source trade: the nonprofit owns hosting, upgrades, and security, and teams without anyone comfortable running infrastructure should price the cloud plans before committing.
What we like- Free forever self-hosted, simple query builder non-technical staff can use, more than 100,000 teams use it, embedding for public dashboards
Watch out for- Self-hosting means the nonprofit owns upgrades, security, and maintenance, and SSO, advanced permissions, and white-labeling sit in paid cloud tiers
#7Zoho Analytics
Best for: Nonprofits already using Zoho apps that want full BI without the enterprise price4.2/5 on
G2 (289 reviews, checked Oct 2026)
Visit zoho.com
Starting pricequote (paid prices not shown on the homepage; checked 21 Nov 2026)
Free planNo free plan; a 15-day free trial with no credit card is available
Zoho Analytics is the value play in self-service BI: an end-to-end platform covering data connection, preparation, visualization, and collaboration, with 500 plus integrations, a drag-and-drop pipeline builder, and an AI assistant called Zia that recommends visualizations and runs predictive analysis. The homepage emphasizes low total cost of ownership: no per-connector charges, no hidden implementation fees, and cloud or on-premise deployment. For a nonprofit, especially one already using Zoho apps, the economics are compelling: one platform that handles donor reporting, forecasting with what-if models, and embedded analytics for a public impact dashboard. Review badges show 4.4 to 4.5 stars across Capterra, G2, and TrustRadius. The honest catch is that paid pricing is not shown on the homepage, and the interface can feel dense for a first-time dashboard builder. Patient users get a lot for the money.
What we like- More than 500 integrations and 50 plus chart types, AI assistant Zia with forecasting, cloud or on-premise deployment, strong value for Zoho shops
Watch out for- Paid pricing is not displayed on the homepage, so budgeting needs a sales conversation, and the interface packs in enough features to overwhelm a first-time dashboard builder
#8Infogram
Best for: Nonprofits that need polished infographics and charts for annual reports and social media4.7/5 on
G2 (183 reviews, checked Oct 2026)
Visit infogram.com
Starting priceFree (Basic); Pro from $19 per month (third-party listing; checked 21 Nov 2026)
Free planYes, free Basic plan
Infogram is a chart and infographic builder aimed at teams that need polished visuals fast, without a BI platform behind them. A nonprofit communications officer can build an annual report graphic, a donor impact chart, or a social media visual from a spreadsheet in an afternoon, using templates designed for the job. The free Basic plan covers the core use case, while Pro starts at $19 a month and Business at $67 a month according to third-party listings, adding more projects, team collaboration, and branding controls. The tool suits the publishing job: one chart, one story, one audience. The honest catch is that the paid prices used here come from third-party listings and should be confirmed on the vendor page before budgeting, and the free plan limits projects and keeps Infogram branding on the output. For a nonprofit that publishes a few charts a month, the free tier often covers the work.
What we like- Easy infographic and chart builder, good templates for annual reports, team collaboration on paid plans, quick publishing for social media
Watch out for- Paid prices come from third-party listings and should be confirmed on the vendor page, and the free plan limits projects and branding options
Frequently asked questions
What is the best data visualization software for a nonprofit
There is no single best tool, because the answer depends on the audience. Looker Studio is the best free start for internal dashboards, Datawrapper is the best choice for charts published on the website, and Flourish is the best choice for animated public stories. Tableau and Power BI are the best choices for a nonprofit that needs governed dashboards for the board, especially with nonprofit discounts, while Metabase is the best free route for a technical team. Most nonprofits end up with one publishing tool and one dashboard tool, not one tool for everything.
Is there a free data visualization tool for nonprofits
Yes, several. Looker Studio is free with no seat limit, self-hosted Metabase is free open source, and Datawrapper, Flourish, and Infogram all offer free plans. The limits matter: Datawrapper and Flourish add attribution or require public publishing on the free plan, and Infogram limits projects. Tableau Desktop is now free to download, and Power BI Desktop is free. A nonprofit should check whether the free plan carries a watermark or publishes the chart publicly before using it for a board pack.
What nonprofit discounts are available for data visualization software
Datawrapper gives nonprofits 20 percent off paid plans. Tableau offers discounted licences through TechSoup, and Microsoft for Nonprofits discounts Power BI and the wider Microsoft 365 stack. Several other vendors offer nonprofit pricing on request, so always ask for the nonprofit price before comparing list prices.
Can data visualization software connect to a donor database
Yes, if it is a BI platform. Tableau, Power BI, Metabase, and Zoho Analytics connect to donor databases such as Salesforce, Raiser's Edge, Bloomerang, and Little Green Light, either directly or through a warehouse. Publishing tools such as Datawrapper, Flourish, and Infogram work from spreadsheets, so the team exports the donor data first and uploads it. A nonprofit that wants live donor dashboards should choose a BI platform, while a nonprofit that publishes a quarterly impact chart can work from a spreadsheet.
How do nonprofits show impact data to funders
The strongest funder reports combine three things: a clear outcome metric, a chart that shows change over time, and a comparison that gives the number context. Datawrapper and Flourish make the public-facing charts, while Tableau, Power BI, or Metabase build the internal dashboards that track the metric every month. Whatever tool a nonprofit uses, the chart should name the metric, the time period, and the data source, because funders trust a chart they can trace back to the data.
Sources we checked (10)
- https://lookerstudio.google.com
- https://www.datawrapper.de/pricing
- https://flourish.studio
- https://www.tableau.com
- https://www.microsoft.com/en-us/power-platform/products/power-bi/
- https://www.metabase.com
- https://www.zoho.com/analytics/
- https://infogram.com
- https://rankite.com/blog/top-data-visualization-software
- https://rankite.com/blog/best-business-intelligence-tools
Is your product missing or out of date?
We review this list regularly. Vendors can request a listing, send updated pricing or ask about featured placement.

Shihab Mia · Founder, Rankite
Shihab has 5+ years in B2B and SaaS SEO. He writes Rankite's software buying guides from pricing pages, documentation and public user reviews. More about Shihab.