How we make this list: we compare pricing pages, product documentation and public user reviews. Ratings come from G2, Capterra or Trustpilot, with the date we checked them.
Key takeaways
- APM pricing models differ so much that the cheapest tool on paper can be the most expensive for your architecture, so compare per-host, per-GB and per-user meters against your own traffic.
- Datadog is the broadest all-in-one platform, New Relic has the most generous free ingest tier, and Dynatrace leads on automatic root cause analysis for large enterprises.
- Developer-led teams get the most value from Sentry, Grafana Cloud and Honeycomb, which all offer real free tiers and open standards support.
- Set retention and cardinality limits on day one, because surprise APM bills almost always come from metrics and logs you never look at.
Quick comparison
| Tool | Best for | Starting price | Free plan |
|---|
 Datadog | All-in-one cloud-native observability | $31 per host/month (APM, billed annually) | Free trial (14 days) |
 New Relic | Usage-based platform with free ingest | 100 GB/month free, then $0.40 per GB | Yes (100 GB/month ingest, 1 full user) |
 Dynatrace | Enterprise automatic root cause | See website | Free trial (15 days) |
 Sentry | Developer error tracking plus APM | $26 per month (Team plan, billed annually) | Yes (Developer plan) |
 Elastic APM | Search-led observability | See website | Free trial |
 Grafana Cloud | Open-source stack users | $19 per month (platform fee, plus usage) | Yes (10K active series, 50 GB logs, 50 GB traces) |
 Splunk Observability | Enterprises already on Splunk | See website | Free trial (14 days) |
 Honeycomb | Trace-first debugging | $150 per month (Pro plan) | Yes (up to 20M events) |
Is your product missing or out of date?
We review this list regularly. Vendors can request a listing, send updated pricing or ask about featured placement.
#1Datadog
Best for: All-in-one cloud-native observability4.4/5 on
G2 (726 reviews, checked Oct 2026)
Visit datadoghq.com
Starting price$31 per host/month (APM, billed annually)
Free planFree trial (14 days)
Datadog is the default choice for cloud-native teams that want one platform instead of five. APM traces connect to infrastructure metrics, logs, real user monitoring and security signals, so an engineer can move from a slow endpoint to the host, the deployment and the log lines behind it without switching tools. The integration catalog covers the major clouds, Kubernetes, serverless platforms and common databases.
The price reflects that breadth. APM starts at $31 per host per month on annual billing, with infrastructure monitoring at $15 per host per month, and logs, custom metrics and other modules metered separately. Teams that run many small hosts or emit high-cardinality metrics should model a real month of usage before signing, and set cardinality and retention policies on day one. Datadog rewards teams that standardize on it fully, and punishes teams that only half adopt it.
What we like- Huge integration catalog
- APM, logs, infrastructure and security in one interface
- Strong cloud-native coverage
Watch out for- Per-host plus per-module meters add up fast
- Custom metrics billing needs care
#2New Relic
Best for: Usage-based platform with free ingest4.4/5 on
G2 (586 reviews, checked Oct 2026)
Visit newrelic.com
Starting price100 GB/month free, then $0.40 per GB
Free planYes (100 GB/month ingest, 1 full user)
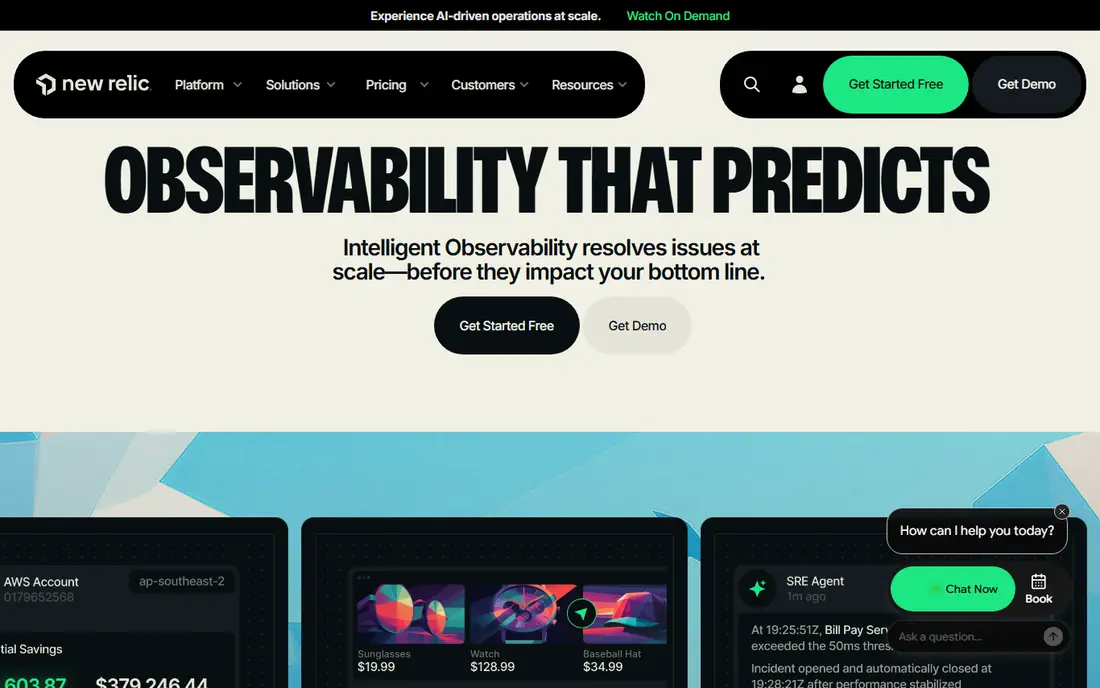
New Relic is the best starting point for teams that want a full platform without a host-based bill. The free tier includes 100 GB of data ingest per month and one full platform user, with full APM included rather than a cut-down version. Paid plans add seats from around $10 per user per month on Standard, with ingest beyond the free allowance at $0.40 per GB in published comparisons.
That model suits startups and teams with spiky traffic, because you pay for data volume rather than a fixed host count. The risk runs the other way: verbose logging or unfiltered traces can push ingest well past the free allowance. New Relic fits teams that are willing to manage what they ingest, and it is a poor fit for teams that want to log everything and sort it out later.
What we like- Genuine free tier with full APM
- Usage-based pricing scales with data, not hosts
- No credit card for free tier
Watch out for- Per-user seats on paid plans
- Costs rise with log and trace volume
#3Dynatrace
Best for: Enterprise automatic root cause4.5/5 on
G2 (1,371 reviews, checked Oct 2026)
Visit dynatrace.com
Starting priceSee website
Free planFree trial (15 days)
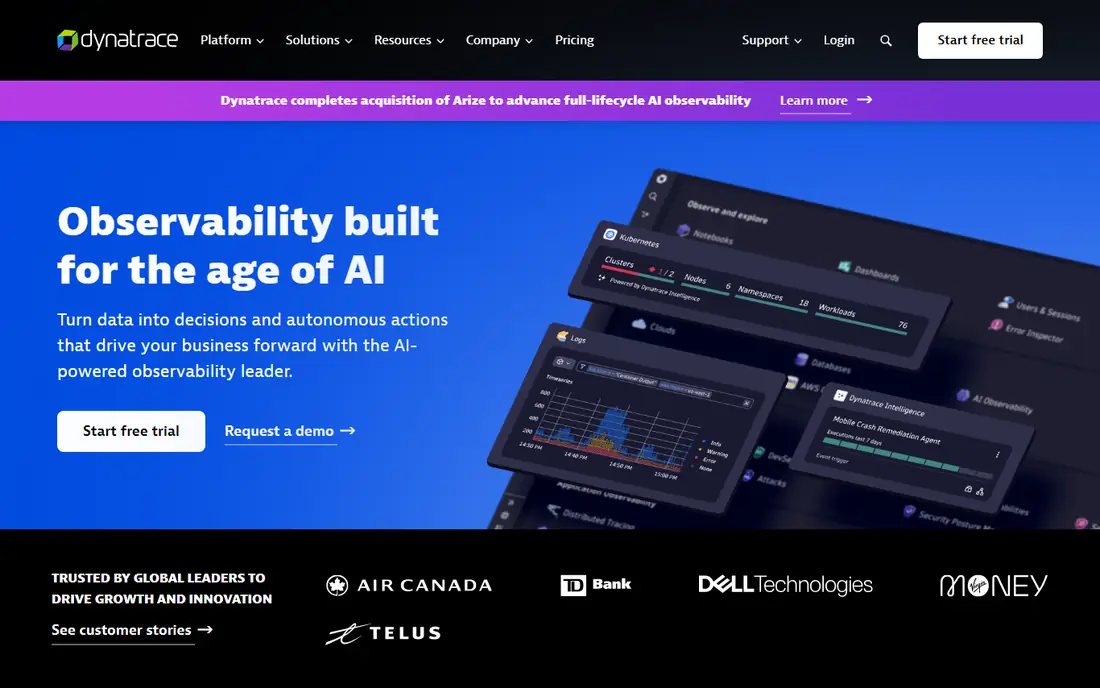
Dynatrace is built for large, complex environments where nobody can draw the system map by hand. Its agent discovers services, hosts and dependencies automatically, and its analysis engine traces problems to a root cause across the full stack instead of handing engineers a pile of charts. That is why it shows up most often in enterprises with hundreds of microservices.
Pricing is quote-led and based on a platform subscription measured in host memory and data volume, with published comparisons putting full-stack monitoring around $58 per 8 GB host per month. That is a premium rate, and smaller teams will find better value elsewhere. Dynatrace earns its price when the alternative is a long outage investigation across teams that each own part of the system.
What we like- Automatic topology mapping
- AI-driven root cause analysis
- Managed self-hosted option
Watch out for- Quote-led pricing
- Premium price for full-stack monitoring
#4Sentry
Best for: Developer error tracking plus APM4.5/5 on
G2 (226 reviews, checked Oct 2026)
Visit sentry.io
Starting price$26 per month (Team plan, billed annually)
Free planYes (Developer plan)
Sentry starts from the developer side of the problem. It captures errors with stack traces, release context and user impact, then adds performance monitoring for transactions and slow endpoints in the same workflow. A developer can go from an alert to the failing line of code without asking an operations team for a dashboard.
The Developer plan is free, and the Team plan starts at $26 per month on annual billing. That makes Sentry the cheapest serious APM entry for product teams, especially those already using it for error tracking. The limit is scope: Sentry does not replace infrastructure monitoring or log management at scale, so larger organizations usually pair it with a platform like Datadog or Grafana rather than relying on it alone.
What we like- Errors and performance in one developer workflow
- Fast setup
- Generous free developer plan
Watch out for- Less infrastructure depth than Datadog or Dynatrace
- Quotas need watching on busy apps
#5Elastic APM
Best for: Search-led observability4.0/5 on
G2 (14 reviews, checked Oct 2026)
Visit elastic.co
Starting priceSee website
Free planFree trial
Elastic APM suits teams that already think in search. Traces, logs and metrics land in Elasticsearch, where engineers can query across all three with one language instead of learning a separate tool for each signal. The open core can be self-hosted at no license cost, which appeals to teams with strict data residency rules or existing Elastic expertise.
Cloud pricing is quote-led and based on deployment size and ingest, with serverless options priced from around $0.07 per GB ingested in published comparisons. The honest catch is operational effort: running Elasticsearch, Kibana and the APM server yourself is a real commitment, and many teams end up on Elastic Cloud to avoid it. Choose Elastic when search is your workflow, not just a feature you might use.
What we like- Powerful search across logs, traces and metrics
- Self-hosted option
- Mature ecosystem
Watch out for- Quote-led cloud pricing
- Running the stack yourself takes real effort
#6Grafana Cloud
Best for: Open-source stack users4.5/5 on
G2 (220 reviews, checked Oct 2026)
Visit grafana.com
Starting price$19 per month (platform fee, plus usage)
Free planYes (10K active series, 50 GB logs, 50 GB traces)
Grafana Cloud packages the open-source observability stack, Prometheus metrics, Loki logs, Tempo traces and Grafana dashboards, as a managed service. Teams invested in open standards get a platform that speaks OpenTelemetry natively and lets them move data elsewhere if they choose. The free tier covers 10,000 active series, 50 GB of logs and 50 GB of traces with three users.
Paid pricing starts with a $19 per month platform fee plus usage meters for series, logs and traces, with published comparisons putting the per-host equivalent around $18 per month. That is competitive, but the meters reward discipline: high-cardinality metrics raise the series count, and verbose logs raise the GB count. Grafana fits teams that like configuring their own stack and want to keep their data portable.
What we like- Open standards and open-source core
- Avoids vendor lock-in
- Strong free tier
Watch out for- Usage meters for series, logs and traces
- Assembling the stack takes configuration
#7Splunk Observability
Best for: Enterprises already on Splunk4.3/5 on
G2 (55 reviews, checked Oct 2026)
Visit splunk.com
Starting priceSee website
Free planFree trial (14 days)
Splunk Observability Cloud, now part of Cisco, brings streaming analytics to APM: data is analyzed as it arrives rather than in batches, which suits teams that need real-time alerting on fast-moving systems. For organizations already running Splunk for logs or security, keeping observability in the same portfolio simplifies procurement and correlation across teams.
Pricing is quote-led, with infrastructure monitoring published around $15 per host per month and APM editions higher, around $45 to $55 per host per month in published comparisons. That puts Splunk at the enterprise end of this list. It is the right choice when the Splunk relationship already exists and real-time streaming matters, and a costly one when bought standalone for a small fleet.
What we like- Streaming real-time analytics
- Strong fit with Splunk log and security products
- Enterprise scale
Watch out for- Quote-led pricing
- APM pricing sits above infrastructure-only rates
#8Honeycomb
Best for: Trace-first debugging4.5/5 on
G2 (37 reviews, checked Oct 2026)
Visit honeycomb.io
Starting price$150 per month (Pro plan)
Free planYes (up to 20M events)
Honeycomb takes a different view of observability: instead of pre-aggregated metrics, it stores wide events with high-cardinality fields and lets engineers ask new questions on the fly. When a bug affects only one customer segment or one version of a service, that query-first approach finds the pattern faster than drilling through dashboards. Teams debugging complex distributed systems rate it highly for exactly that reason.
The free tier covers up to 20 million events, which is generous for small teams, and the Pro plan starts at $150 per month with usage-tiered pricing from around $3.00 per million events in some comparisons. Honeycomb does not try to be an infrastructure monitor, so most teams pair it with a metrics tool. Buy it for debugging depth, not for replacing your whole observability stack.
What we like- High-cardinality event debugging
- Fast ad-hoc queries
- Excellent free tier for small teams
Watch out for- Pro plan starts at $150 per month
- Less infrastructure monitoring than all-in-one rivals
How we chose
We compared tools on pricing model, free tier quality, breadth of signals, open standards support and the limits reviewers cite most often. Sources included vendor pricing pages and independent comparisons checked in September and October 2026, including a cross-vendor cost matrix and several category guides. Prices in APM change often and vary by host size, data volume and commitment, so figures from comparison guides are flagged as such and anything unverified on the vendor's own page is marked "See website". We did not claim hands-on testing.
What to check before you sign
Start by naming your pricing meter. If you run many small hosts, a per-host tool like Datadog or Dynatrace will cost more than the headline rate suggests. If you emit large log volumes, a per-GB tool like New Relic or Grafana Cloud needs ingest controls. Run a one-month pilot on a real service, measure the actual meter, and only then compare vendors on equal footing.
Next, check instrumentation effort. OpenTelemetry support matters because it lets you switch vendors later without rewriting instrumentation, and most tools here accept it natively or through a collector. Confirm which languages and frameworks your services use are covered, and whether mobile or browser monitoring is included or billed separately.
Finally, test the debugging path, not the demo dashboard. Pick a real past incident, replay it in the trial, and time how long it takes to reach the root cause. A tool that looks beautiful in a demo but slows down a real investigation will cost you far more in outage time than any subscription saving. Set retention, cardinality and ingest limits on day one, and review the bill weekly during the first quarter.
Frequently asked questions
What is application performance monitoring software?
APM software tracks how an application behaves in production: response times, error rates, throughput and the traces that show how a request moves across services. It turns that data into alerts and dashboards so teams find slow endpoints and failures before users report them.
How much does APM software cost?
Entry prices range from free tiers at New Relic, Sentry, Grafana Cloud and Honeycomb to around $31 per host per month for Datadog APM and quote-led enterprise pricing at Dynatrace and Splunk. The total depends on your pricing meter, so model a real month of hosts, data volume or users before choosing.
Is there a free APM tool?
Yes. New Relic offers 100 GB of monthly ingest free, Sentry offers a free Developer plan, Grafana Cloud offers a free tier with metrics, logs and traces, and Honeycomb offers up to 20 million events free. Free tiers suit small teams and pilots, while production fleets usually need a paid plan.
Do I need APM if I already have infrastructure monitoring?
Infrastructure monitoring shows host health, but it cannot show why a single endpoint is slow or which service in a chain caused an error. APM adds distributed traces and transaction-level detail, which is what you need to debug application problems rather than server problems.
What is OpenTelemetry and why does it matter?
OpenTelemetry is an open standard for collecting traces, metrics and logs, supported by most tools in this list. Using it means your instrumentation is portable, so switching APM vendors later does not require rewriting every service.
Can one APM tool cover errors, logs and infrastructure too?
Some can. Datadog, New Relic and Dynatrace cover most signals in one platform, while Sentry and Honeycomb focus on errors and traces and pair with other tools for infrastructure. Decide whether you want one vendor or a best-of-breed stack before comparing prices.
Sources we checked (5)
- https://monitoringcost.com/
- https://rankite.com/blog/best-apm-software
- https://rankite.com/blog/best-application-performance-management-tools
- https://last9.io/blog/best-observability-tools/
- https://coralogix.com/guides/application-performance-monitoring-tools/
Is your product missing or out of date?
We review this list regularly. Vendors can request a listing, send updated pricing or ask about featured placement.

Shihab Mia · Founder, Rankite
Shihab has 5+ years in B2B and SaaS SEO. He writes Rankite's software buying guides from pricing pages, documentation and public user reviews. More about Shihab.