How we make this list: we compare pricing pages, product documentation and public user reviews. Rankite is independent; if a vendor ever pays for a featured spot, that listing is clearly labeled Partner.
Key takeaways
- Datadog at $31 per host per month for APM is the all-in-one standard for cloud-native teams.
- New Relic's 100 GB per month free ingest makes it the best starting point for startups.
- Dynatrace leads on automatic root cause analysis for large enterprises, at roughly $58 per 8 GB host per month.
- Grafana Cloud and Sentry offer the strongest free tiers for open-source and developer-led teams.
Quick comparison
| Tool | Best for | Starting price | Free plan |
|---|
 Datadog Datadog | All-in-one cloud-native observability | $31/host/month (APM) | Free trial |
 New Relic New Relic | Usage-based all-in-one platform | $49/user/month | Free plan |
 Dynatrace Dynatrace | Enterprise automatic root cause | ~$58/host/month | Free trial |
 Sentry Sentry | Developer error tracking plus APM | $26/month | Free plan |
 Elastic APM Elastic APM | Search-led observability | See website | Free plan |
 Grafana Cloud Grafana Cloud | Open-source stack users | $19/month | Free plan |
 Splunk Observability Splunk Observability | Splunk portfolio enterprises | $55/host/month | Free trial |
 IBM Instana IBM Instana | Auto-discovery at fine granularity | See website | Free trial |
 Honeycomb Honeycomb | Trace-first debugging | $150/month | Free plan |
Is your product missing or out of date?
We review this list regularly. Vendors can request a listing, send updated pricing or ask about featured placement.
The best APM software
Starting price$31/host/month (APM)
Free planFree trial
Datadog is the default observability platform for cloud-native teams. APM with distributed tracing, infrastructure monitoring, logs, RUM and synthetics live in one interface with a service map that shows how everything connects. The integration catalog is unmatched: if it emits metrics, Datadog probably ingests them.
Pricing is the perennial complaint. APM runs $31 per host per month on annual billing, but infrastructure monitoring, log ingest and custom metrics bill separately, and totals surprise first-time buyers. For teams that want one vendor and can manage the billing complexity, Datadog remains the benchmark.
What we like- 1,000+ integrations
- Mature unified UI
- Strong service mapping
Watch out for- Costs compound across products
- Per-host model fights autoscaling
Starting price$49/user/month
Free planFree plan
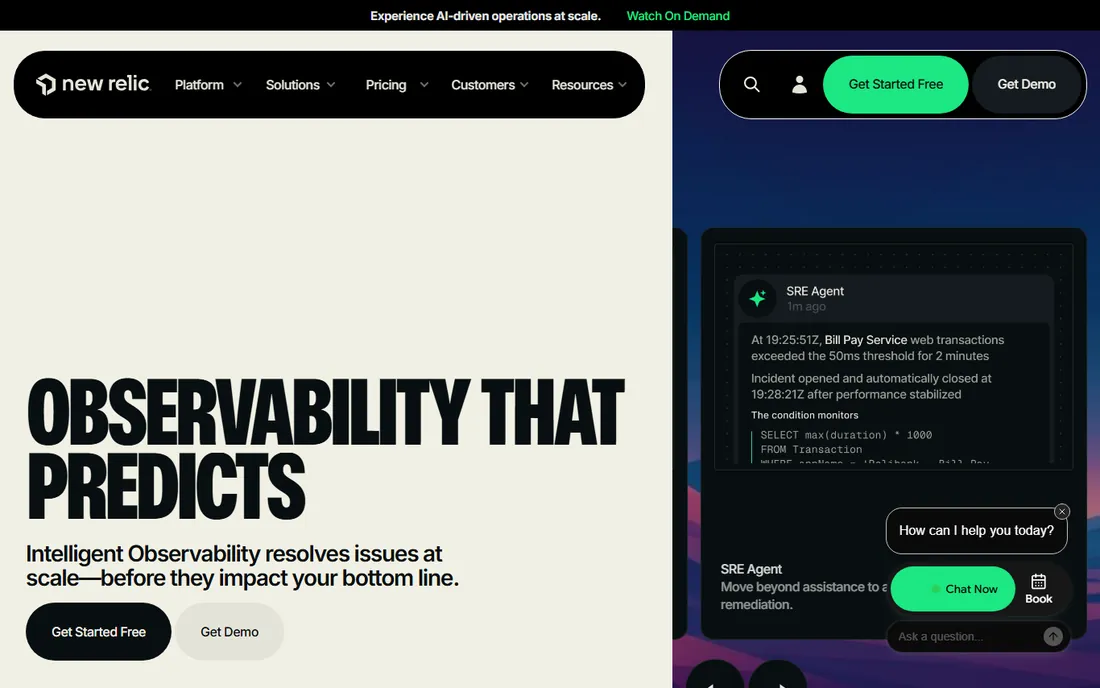
New Relic rebuilt its pricing around simplicity: 100 GB of data ingest per month free, then $0.40 per GB, with platform access from $49 per user per month. One meter instead of per-host counting suits variable cloud workloads, and the free tier is genuinely enough for small applications.
Heavy log volumes push ingest costs up fast, and giving the whole team full access multiplies seat fees. For startups and small teams that want serious APM without a sales call, the free tier is the best on-ramp in the category.
What we like- 100 GB per month free ingest
- Single usage-based meter
- Full platform access
Watch out for- Per-user fees add up
- Ingest overages cost real money
Starting price~$58/host/month
Free planFree trial
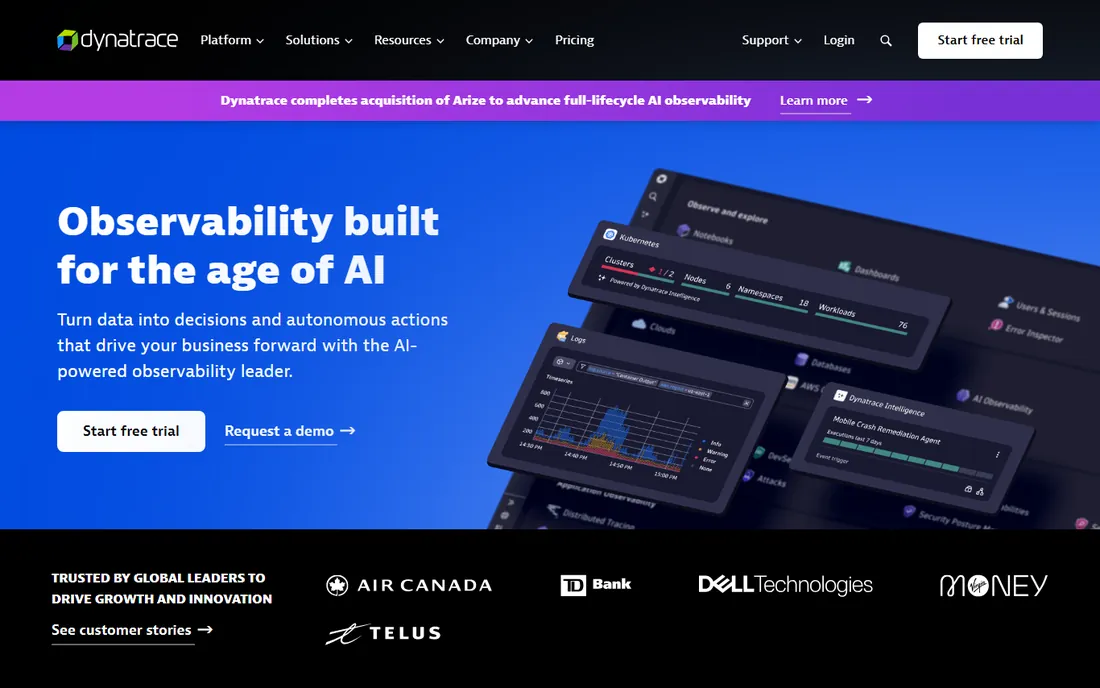
Dynatrace's Davis AI does what every APM promises: it tells you the actual root cause instead of a dashboard of symptoms. OneAgent auto-discovers services, baselines behavior and flags anomalies with causal precision. Large enterprises with complex microservices get value that manual dashboards cannot match.
The price reflects it: around $58 per month per 8 GB host for full-stack monitoring, with consumption-based DPS licensing. There is no cheap entry point. For enterprises where downtime costs thousands per minute, Dynatrace's automation justifies the premium.
What we like- Davis AI causal root cause analysis
- Automatic baselining
- Minimal configuration
Watch out for- Highest list prices
- Bundled model prevents starting small
Starting price$26/month
Free planFree plan
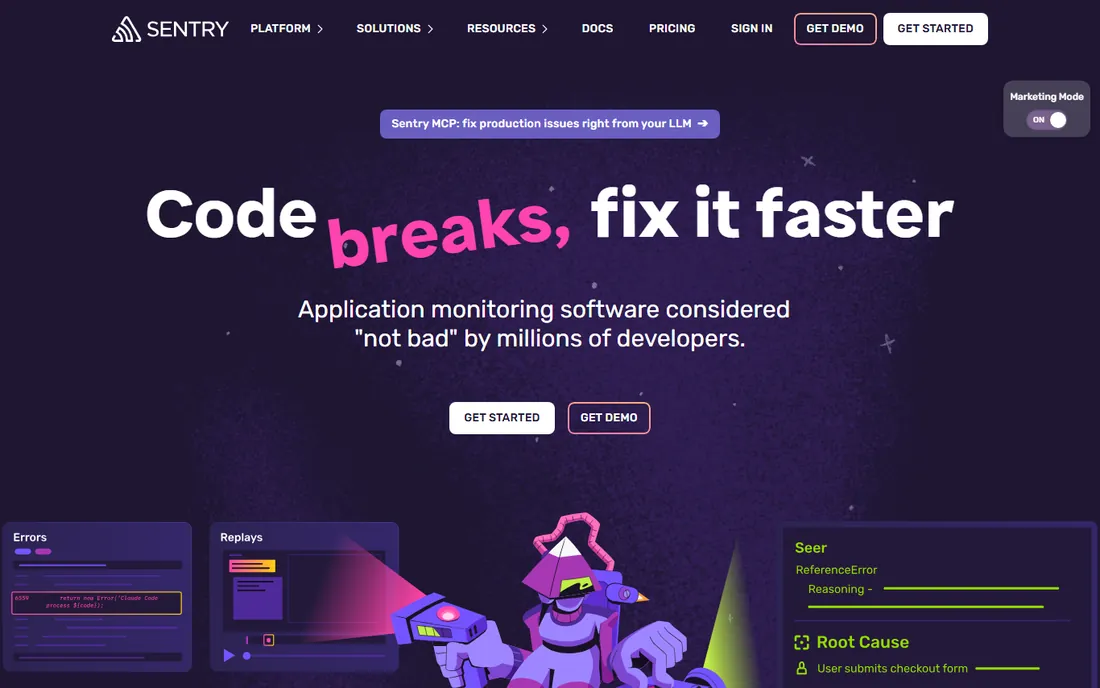
Sentry started in error tracking and grew into performance monitoring. When an error fires, the linked trace shows exactly what led to it, which is the workflow developers actually want. The free Developer tier is generous, and Team plans start at $26 per month.
Sentry is not infrastructure monitoring; pair it with something else for hosts and containers. For application teams that care about user-facing errors and slow transactions more than server metrics, Sentry is the developer favorite.
What we like- Developers love it
- Error tracking with tracing context
- Generous free tier
Watch out for- Not a full infrastructure platform
- Sampling decisions affect costs
Starting priceSee website
Free planFree plan
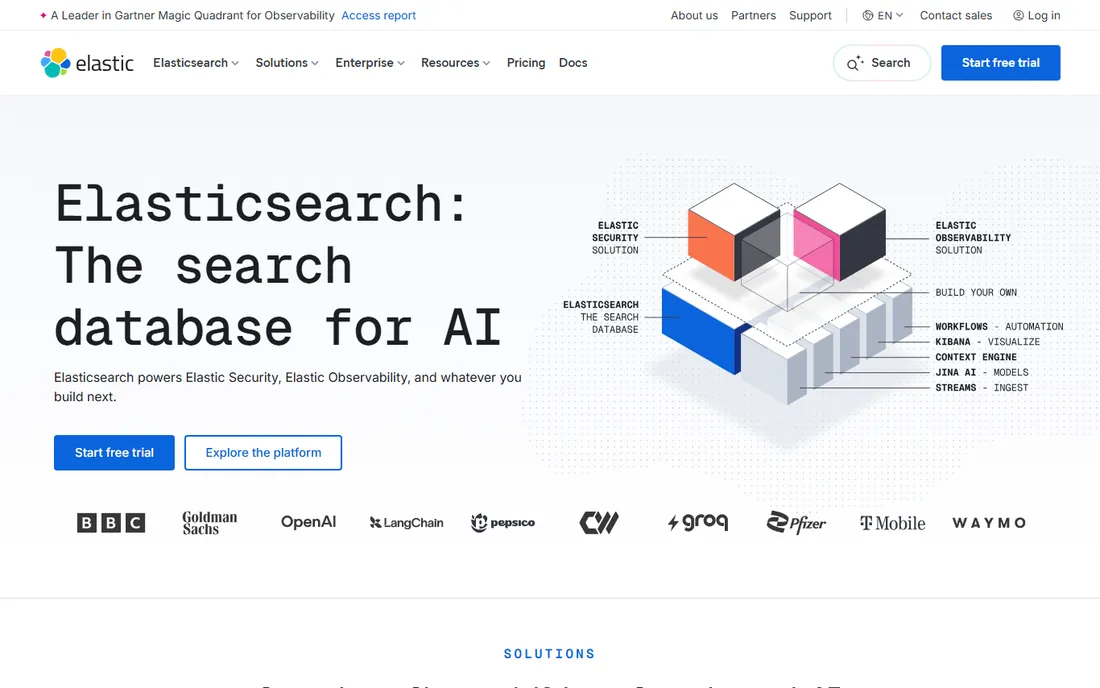
Elastic APM brings application tracing into the Elasticsearch world. Teams already centralizing logs in Elastic get APM almost as an extension, with the same powerful search across traces, logs and metrics. The self-managed version is free, which appeals to cost-conscious and data-sovereignty-minded organizations.
Running the Elastic Stack yourself is real operational work. Elastic Cloud simplifies it with usage-based pricing. For log-heavy organizations that think in search queries, Elastic APM fits the existing muscle memory.
What we like- Free self-managed option
- Powerful log search
- OpenTelemetry support
Watch out for- Self-hosting needs expertise
- Cloud pricing is usage-complex
Starting price$19/month
Free planFree plan
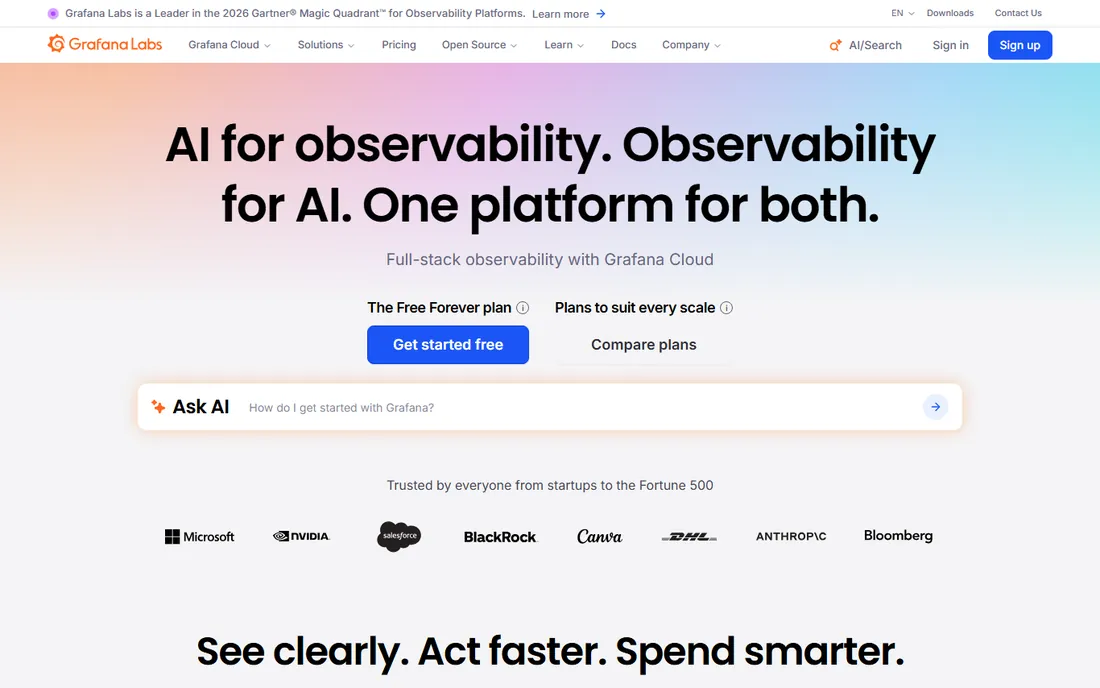
Grafana Cloud packages the beloved open-source stack (Prometheus, Loki, Tempo, Mimir) as a managed service. The free tier includes 10,000 metric series plus 50 GB each of logs and traces, which covers small production workloads. Pro starts at $19 per month plus usage.
It is less turnkey than Datadog or New Relic: you bring the OpenTelemetry instrumentation and the dashboard-building mindset. For teams already on Prometheus who want managed scale without lock-in, Grafana Cloud is the natural home.
What we like- Most generous free tier
- Open-source foundation
- No vendor lock-in
Watch out for- Less turnkey
- Needs PromQL and labeling discipline
Starting price$55/host/month
Free planFree trial
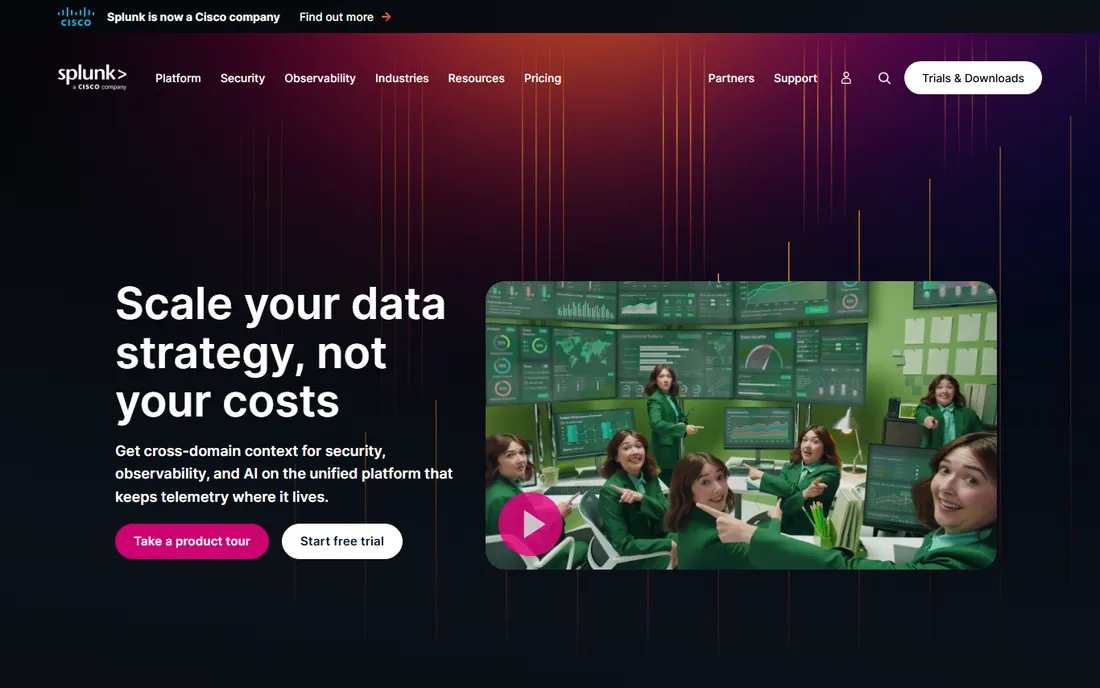
Splunk Observability Cloud combines APM, infrastructure monitoring and RUM for enterprises already invested in Splunk. APM runs $55 per host per month on annual billing. With AppDynamics now part of Splunk, business-transaction monitoring joins the portfolio.
This is enterprise software with enterprise pricing and complexity. The value concentrates where Splunk SIEM, IT and observability consolidate under one vendor. Smaller teams will find it oversized.
What we like- Deep integration with Splunk SIEM
- Enterprise proven
- AppDynamics now included
Watch out for- Premium pricing
- Complexity suits large teams
#8
IBM Instana
Best for: Auto-discovery at fine granularity
Visit ibm.com
Starting priceSee website
Free planFree trial
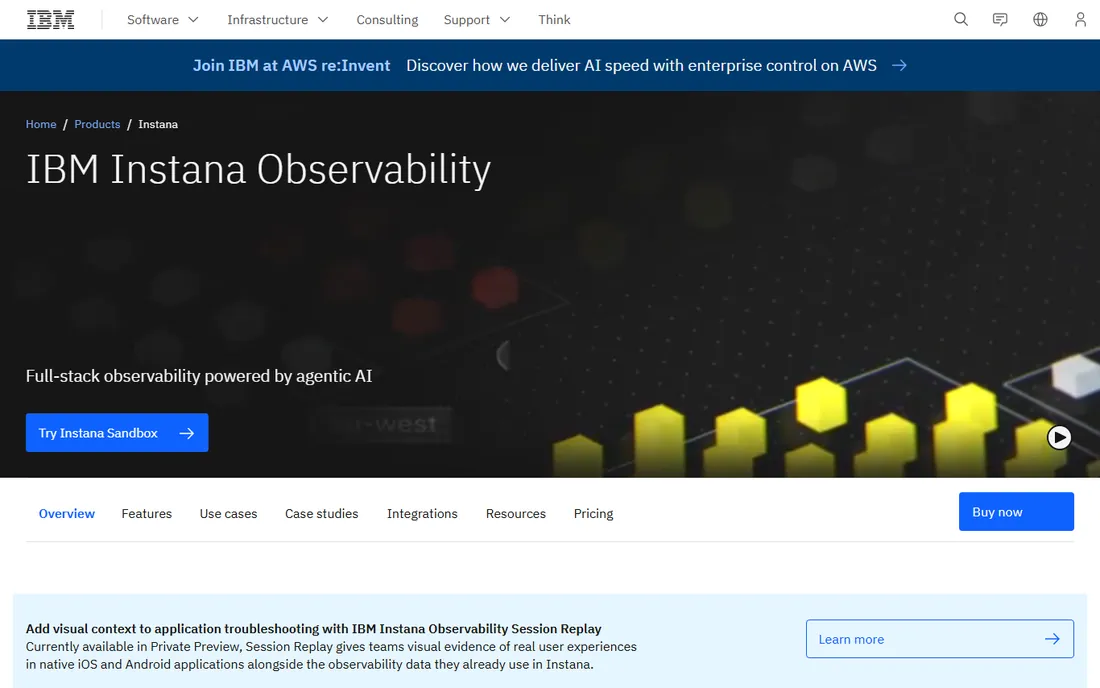
Instana (IBM) automates APM aggressively: agents auto-discover services, containers and dependencies with one-second granularity and map them without manual configuration. Both SaaS and self-hosted deployment are available, which suits regulated industries.
Pricing is quote-based through IBM. The product shines in dynamic microservice environments where manual instrumentation cannot keep up. For enterprises standardizing on IBM, Instana completes the observability picture.
What we like- One-second granularity auto-discovery
- Minimal manual setup
- SaaS or self-hosted
Watch out for- Quote-based pricing
- IBM sales process
Starting price$150/month
Free planFree plan
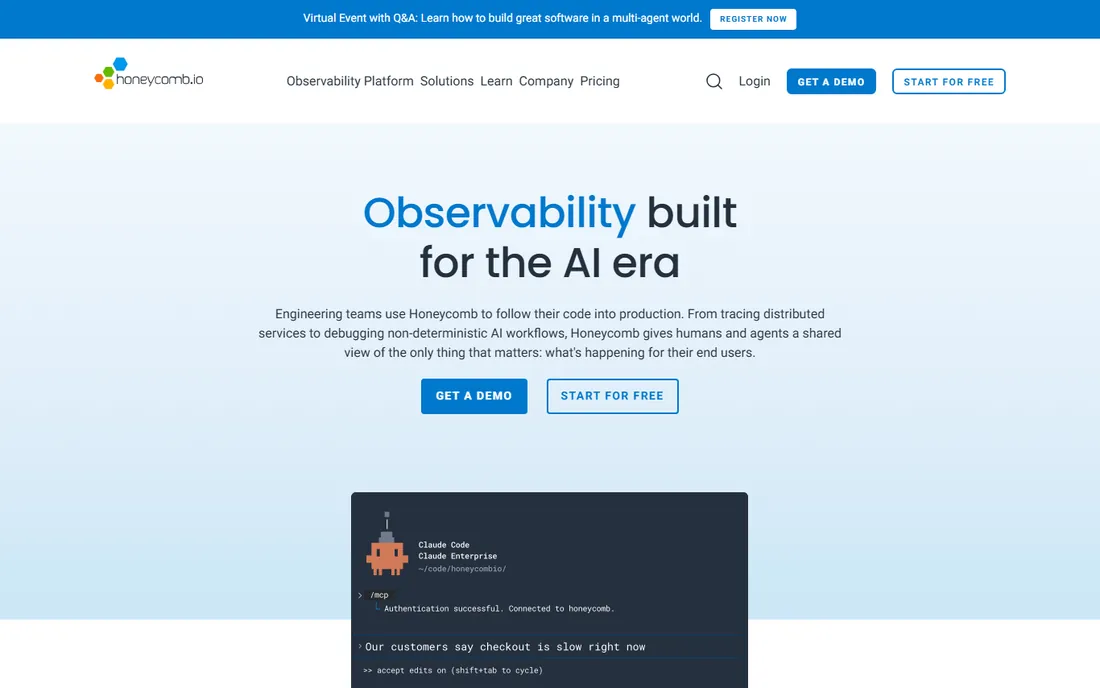
Honeycomb takes a different approach: wide structured events instead of pre-aggregated metrics, queried ad hoc at speed. Debugging production mysteries with high-cardinality data (user IDs, request attributes) is where it excels. The free tier covers 20 million events, and Pro starts at $150 per month.
The event-based model requires unlearning metric habits. Teams that adopt it tend to become evangelists. For complex distributed systems where the question is always "which specific requests are slow and why," Honeycomb is the specialist's tool.
What we like- High-cardinality event debugging
- Fast ad-hoc queries
- Beloved by senior engineers
Watch out for- Different mental model
- Pro starts at $150/month
The pricing unit decides your bill
APM vendors meter differently, and the meter shapes your costs. Per-host pricing (Datadog, Splunk) punishes autoscaling and microservices sprawl. Per-GB ingest (New Relic, Coralogix-style) punishes log verbosity. Per-user (New Relic seats) punishes broad access. Consumption units (Dynatrace DPS) bundle everything opaquely.
Before committing, estimate with your real numbers: host count, monthly ingest volume, and how many engineers need access. Run the free tier or trial with production-like traffic, because estimates from docs rarely match reality.
What to instrument first
Start with the golden signals: latency, traffic, errors and saturation for every service. Add distributed tracing to follow requests across services. Then layer business context: which endpoints drive revenue, which users hit errors. Alert on symptoms users feel (error rate, latency percentiles), not on infrastructure trivia. The best APM tool poorly instrumented loses to a mediocre tool well instrumented.
Reducing alert fatigue: the paging problem
Every APM implementation eventually faces the same crisis: too many alerts, too little signal, and an on-call team that has learned to ignore the pager. Alert fatigue is not a tooling problem; it is a configuration problem, and it is fixable. The root cause is almost always alerting on symptoms instead of user impact. CPU at 90 percent is not a problem if users are happy. Error rates spiking on the checkout service is a problem even if CPU is fine. The fix starts with redefining what pages: only conditions that require immediate human action, affecting real users, right now. Everything else becomes a ticket, a dashboard, or nothing at all. Most teams can cut paging alerts by 70 percent with this filter alone, and reliability does not suffer.
Service-level objectives give alerts their meaning. Define SLIs (the metrics that measure user experience: request latency, error rate, availability) and SLOs (the targets: 99.9 percent of requests under 500ms). Alert on SLO burn rate, not on raw metrics. A burn-rate alert fires when you are consuming your error budget too fast, which means it fires exactly when user experience is degrading and stays quiet during harmless spikes. Every APM tool here supports SLO-based alerting with varying sophistication. The implementation takes thought: choosing SLIs, setting realistic SLOs, tuning burn-rate windows. But it transforms alerting from noise into a reliable signal that the team trusts. Trust is the whole game; an alert the team trusts gets acted on in minutes.
Alert routing and ownership prevent the bystander effect. Every alert must have exactly one owner: a team, a rotation, a runbook. Alerts owned by "everyone" are owned by no one. Route by service ownership from your service catalog, with escalation paths for unacknowledged pages. Deduplicate aggressively: one incident should produce one alert, not seventeen from seventeen affected services. Modern APM platforms correlate related alerts into incidents automatically; configure this before you need it. Also set expectations for acknowledgment: five minutes for critical, thirty for warning. Track these metrics and review them in incident retrospectives. Alert hygiene is operational hygiene.
Runbooks turn alerts into action. Every paging alert should link to a runbook: what this alert means, how to verify it is real, the first three things to try, when to escalate, and who to call. Runbooks do not need to be perfect; a rough runbook beats none. The on-call engineer at 3 AM needs a starting point, not a blank page. Review runbooks after every incident: did the runbook help, what was missing, what was wrong. This feedback loop is how operational knowledge compounds instead of living in one senior engineer's head. Teams with good runbooks resolve incidents faster and onboard new on-call members in weeks instead of months.
Finally, treat alert tuning as continuous work, not a setup task. Schedule a monthly alert review: which alerts fired, which were actionable, which were noise. Tune or delete the noisy ones. The goal is a pager that stays silent for weeks and commands instant attention when it sounds. That contrast is what makes on-call sustainable. Engineers who get paged twice a month for real incidents stay sharp and engaged. Engineers who get paged twenty times a night for noise burn out and leave. The APM tool provides the data; the alert discipline provides the sleep.
Frequently asked questions
What is APM software?
Application performance monitoring tracks how your software behaves in production: response times, error rates, throughput and resource use, traced across services. It tells you what is slow, what is broken and why, before users complain.
How much does APM software cost?
Entry points range from free tiers (New Relic 100 GB, Grafana Cloud, Sentry) to $19 to $31 per host per month (Datadog, Grafana Pro). Enterprise options run $55 to $58+ per host per month. Ingest-based models scale with data volume instead.
Do I need APM if I have infrastructure monitoring?
They answer different questions. Infrastructure monitoring watches servers; APM watches application behavior across services. For a monolith on one server, infrastructure monitoring may suffice. For microservices, APM is essential.
What is distributed tracing?
Tracing follows a single request as it travels through your services, showing where time goes at each step. It is the core APM technique for debugging slowness in microservice architectures.
Can open-source APM replace Datadog?
For metrics and tracing, Prometheus plus Grafana Tempo or Jaeger cover a lot, especially via Grafana Cloud's managed offering. You trade turnkey convenience and support for control and lower cost. Many teams run both: open source for metrics, commercial for incident workflows.
How do I avoid surprise APM bills?
Set ingest limits and alerts from day one. Sample traces aggressively in high-volume services. Audit which products are enabled (Datadog bills per product). Review the bill monthly for the first quarter; cardinality explosions are the usual culprit.
How we chose
We compared the APM platforms engineering teams actually evaluate, from free tiers to enterprise suites. Pricing comes from vendor pages and recent published benchmarks; quote-based tools are marked as such. We weighted tracing quality, pricing transparency, free tier usefulness and fit for different team sizes. No hands-on testing was performed; assessments rest on documentation and public reviews.
Sources we checked (11)
- https://www.datadoghq.com/pricing/
- https://newrelic.com/pricing
- https://www.dynatrace.com/platform/pricing/
- https://sentry.io/pricing/
- https://www.elastic.co/pricing
- https://grafana.com/pricing/
- https://www.splunk.com/
- https://www.ibm.com/products/instana
- https://www.honeycomb.io/pricing
- https://coralogix.com/guides/application-performance-monitoring/application-performance-monitoring-tools/
- https://middleware.io/blog/apm-tools/
Is your product missing or out of date?
We review this list regularly. Vendors can request a listing, send updated pricing or ask about featured placement.

Shihab Mia · Founder, Rankite
Shihab has spent more than a decade helping SaaS and e-commerce brands grow through search. He writes Rankite's software buying guides from pricing pages, documentation and public user reviews. More about Shihab.