How we make this list: we compare pricing pages, product documentation and public user reviews. Rankite is independent; if a vendor ever pays for a featured spot, that listing is clearly labeled Partner.
Key takeaways
- The cheapest credible APM start is a free tier, not a cheap plan: New Relic (100 GB/month free), Grafana Cloud (free tier, no card) and Sentry (free Developer plan) all let small teams run production monitoring at zero cost.
- Per-host pricing still rules the mid-market: Datadog APM starts at $36/host/month billed annually, which gets expensive fast past a dozen hosts. Count hosts before you fall in love with a demo.
- Honeycomb is the pick for debugging complex distributed systems: event-based pricing from $3.00 per million events rewards teams that instrument richly rather than sampling.
- Dynatrace and Elastic suit enterprises that want AI-driven root cause or a self-managed stack. Both are quote-led, so bring your host counts and data volumes to the sales call.
Quick comparison
| Tool | Best for | Starting price | Free plan |
|---|
 Datadog Datadog | Teams that want infrastructure, APM, logs and security in one platform | $36/host/month (APM standalone, billed annually) | Free trial (14 days) |
 New Relic New Relic | Teams that prefer usage-based pricing and a genuinely free tier | Free tier; paid from $10/month (first full user, Standard) plus $0.40/GB data | Yes (100 GB/month ingest, 1 full user, no credit card) |
 Dynatrace Dynatrace | Enterprises that want AI-driven root cause analysis at scale | See website (custom quote) | Free trial |
 Honeycomb Honeycomb | Engineering teams debugging complex distributed systems | Pro from $3.00 per million events (usage-tiered) | Yes (Free plan) |
 Sentry Sentry | Developers who want error tracking and performance monitoring in one workflow | $26/month (Team plan, billed annually) | Yes (Developer plan free; 14-day Business trial, no card) |
 Elastic Elastic | Teams that want APM on infrastructure they control | See website (custom quote) | Free trial (no credit card) |
 Grafana Cloud Grafana Cloud | Teams built on open standards that want to avoid vendor lock-in | Free tier; paid from $0.025/host hour (~$18/host/month) plus $19/month platform fee | Yes (free tier, no credit card) |
Is your product missing or out of date?
We review this list regularly. Vendors can request a listing, send updated pricing or ask about featured placement.
Here is an unpopular opinion among vendors: most teams buy more APM than they use. They pay per host for a platform that does infrastructure, logs, RUM, synthetics and security, then only ever look at the service map and the slow traces. The tools below are all good. The right one is the one whose pricing model matches how your system actually scales.
Seven platforms, priced from each vendor's own pricing page where published, with the honest trade-offs for each.
#1
Datadog
Best for: Teams that want infrastructure, APM, logs and security in one platform
Visit datadoghq.com
Starting price$36/host/month (APM standalone, billed annually)
Free planFree trial (14 days)
Datadog is the default enterprise APM pick for a reason: it does nearly everything, and it does it in one place. APM standalone starts at $36 per host per month billed annually ($41 for APM Pro, $47 for Enterprise), and you can buy it without infrastructure monitoring. Distributed tracing, continuous profiling, log correlation and 800-plus integrations make it the safe choice when nobody wants to be the person who picked the small vendor.
The honest catch is the bill. Datadog prices per product per host, so a 50-host footprint running APM Pro plus infrastructure plus logs lands in five figures monthly. Model your host count, container count and log volume before committing, and use the 14-day trial with production-level traffic, not a staging toy. If your architecture is modest, the tools below deliver 80 percent of the value at a fraction of the cost.
What we like- The broadest observability catalog in the industry, with 800-plus integrations
- APM, continuous profiler and infrastructure correlate in one UI
- Per-product pricing lets you buy APM without the whole platform
Watch out for- Costs compound fast: APM plus infrastructure plus logs on many hosts adds up quickly
- The pricing page needs a spreadsheet to model
#2
New Relic
Best for: Teams that prefer usage-based pricing and a genuinely free tier
Visit newrelic.com
Starting priceFree tier; paid from $10/month (first full user, Standard) plus $0.40/GB data
Free planYes (100 GB/month ingest, 1 full user, no credit card)
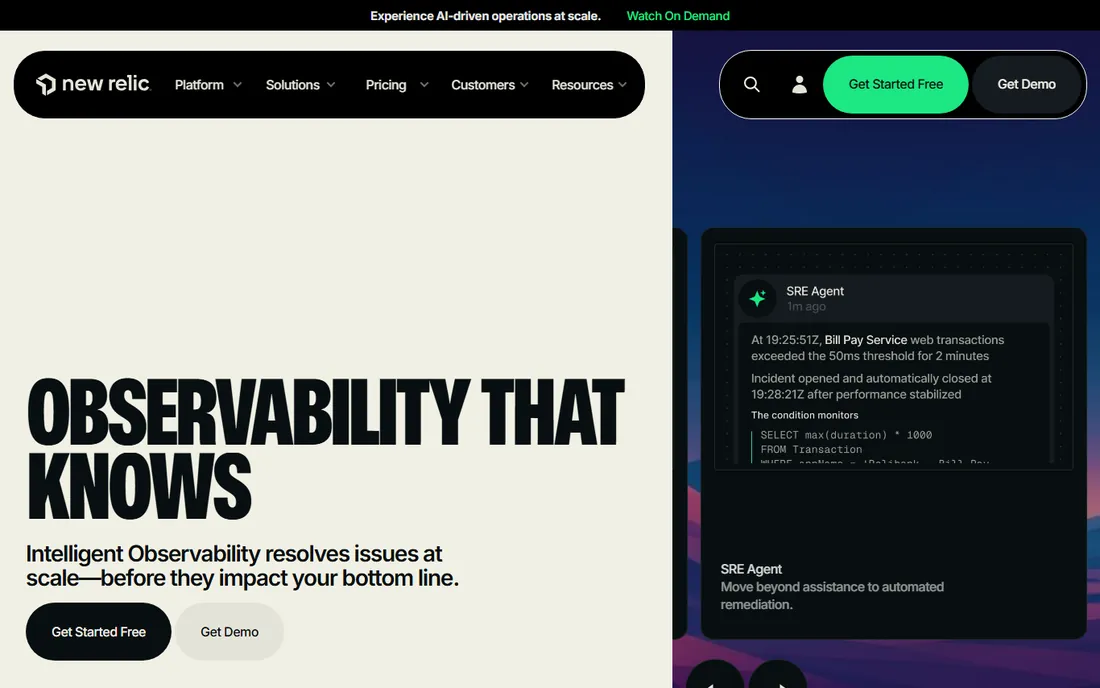
New Relic rebuilt its pricing around a simple idea: unlimited hosts, pay for users and data. The free tier (100 GB/month, one full platform user, no credit card) is enough for a small production system to run real APM indefinitely, which makes it the lowest-risk way to start. Paid Standard begins at $10/month for the first full user, with data at $0.40/GB beyond the free 100 GB.
This model favors teams with many hosts but few engineers, the opposite of Datadog's math. Watch the data ingest: verbose logging and high-cardinality attributes burn through gigabytes, and the bill follows. For startups and small teams, though, New Relic's free tier plus transparent usage pricing is the easiest APM on-ramp in the industry.
What we like- The most generous free tier in APM: 100 GB a month, a full platform user and 50-plus capabilities at no cost
- No host counting, pricing follows users and data
- All-in-one platform from APM to synthetics to AI monitoring
Watch out for- Data overage at $0.40/GB can surprise teams with chatty instrumentation
- User-based tiers mean adding engineers raises the bill even if hosts stay flat
#3
Dynatrace
Best for: Enterprises that want AI-driven root cause analysis at scale
Visit dynatrace.com
Starting priceSee website (custom quote)
Free planFree trial
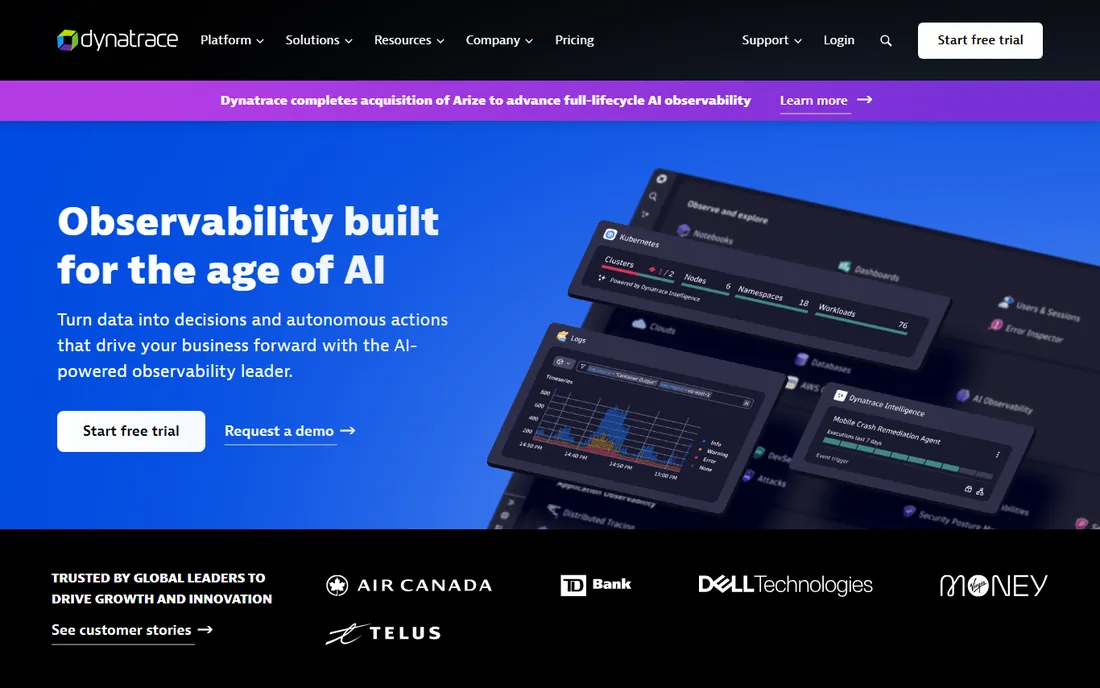
Dynatrace sells answers, not charts. Its Davis AI correlates problems across the stack and names probable root causes, which is why large enterprises with hundreds of services choose it over dashboard-centric tools. The platform covers APM, distributed tracing, profiling, infrastructure, logs, RUM and security in one agent-based deployment.
Everything about the commercial model says enterprise: custom quotes, consumption-based licensing that takes a call to model, and implementations that assume a platform team. Small teams should look elsewhere. Large organizations standardizing observability across business units will find Dynatrace's automation worth the sales cycle, but get the full consumption estimate in writing before signing.
What we like- Davis AI delivers causal root-cause answers rather than raw dashboards, which large ops teams value
- Full-stack coverage from APM to infrastructure to digital experience
- Strong enterprise compliance and security posture
Watch out for- Quote-based pricing with a complex consumption model
- Overkill in both price and complexity for small teams
#4
Honeycomb
Best for: Engineering teams debugging complex distributed systems
Visit honeycomb.io
Starting pricePro from $3.00 per million events (usage-tiered)
Free planYes (Free plan)
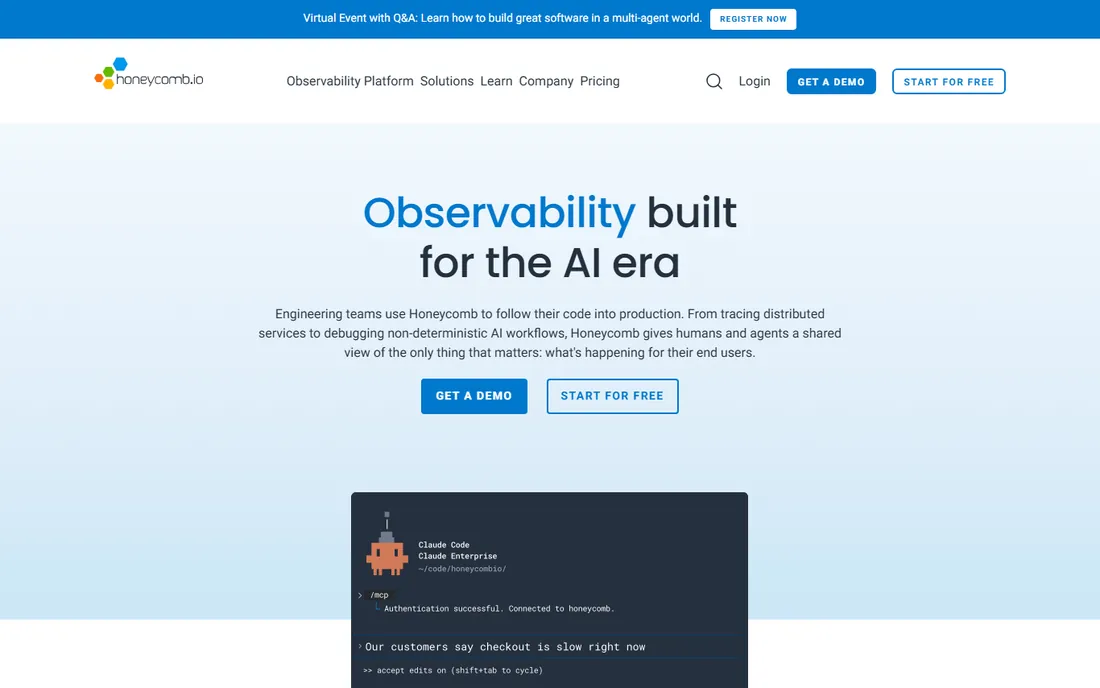
Honeycomb is the debugger's APM. Instead of pre-aggregated metrics, it stores wide events you can slice by any attribute, which is exactly what you need when the bug is "slow for 0.3 percent of users in one region on Tuesdays." BubbleUp highlights the attributes that distinguish bad events from good ones, and the 2026 plans added time-series metrics and AI-assisted investigation.
The pricing changed in 2026: Pro now runs $3.00 per million events across four tiers topping out at 750M events a month. That rewards efficient instrumentation and punishes spray-and-pray telemetry. Teams that already think in OpenTelemetry and want the best raw debugging experience will love it. Teams that want one platform for APM plus infrastructure plus logs should pair it with something else or pick Datadog.
What we like- Event-based model with high-cardinality data and no sampling games, ideal for finding unknown unknowns
- BubbleUp and heatmaps make outlier debugging fast
- OpenTelemetry-native with no vendor lock-in
Watch out for- 2026 Pro pricing moved to $3.00 per million events, so high-volume teams must model carefully
- It is a debugging tool first, not a full infrastructure monitoring suite
#5
Sentry
Best for: Developers who want error tracking and performance monitoring in one workflow
Visit sentry.io
Starting price$26/month (Team plan, billed annually)
Free planYes (Developer plan free; 14-day Business trial, no card)
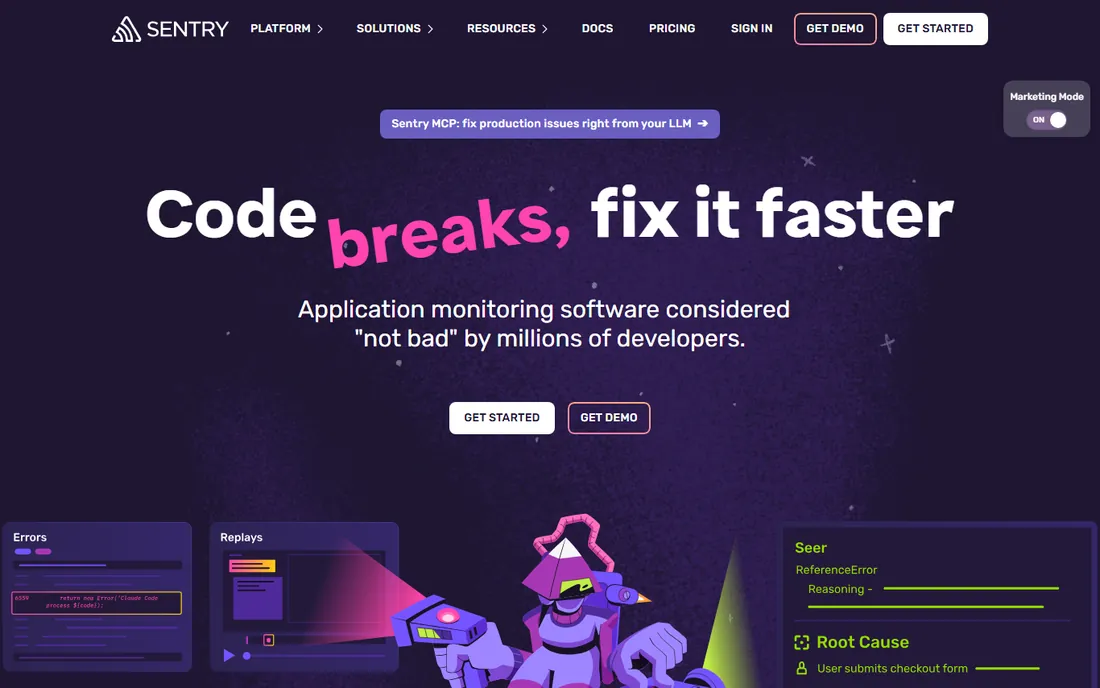
Sentry started as error tracking and grew into application monitoring without losing its developer soul. Instrumentation takes minutes, and when something breaks you get the error, the trace, the session replay and the logs in one place, plus an AI debugger that suggests fixes. The Team plan at $26/month (annual) includes 50K errors a month, and the free Developer plan covers solo projects.
It is not trying to be Datadog. There is no infrastructure monitoring empire here, just application visibility done well. For product engineering teams whose APM need is "why is this slow and whose code caused it," Sentry is the fastest path from signal to fix. Platform teams running hundreds of services will eventually want the heavier tools above.
What we like- Five lines of code to instrument, with errors, traces, replays and logs tied to the same issue
- Transparent event-based pricing starting at $26/month
- Developer-loved workflow from alert to fix
Watch out for- APM depth trails the dedicated platforms for complex microservice estates
- Event volume pricing needs attention at scale
#6
Elastic
Best for: Teams that want APM on infrastructure they control
Visit elastic.co
Starting priceSee website (custom quote)
Free planFree trial (no credit card)
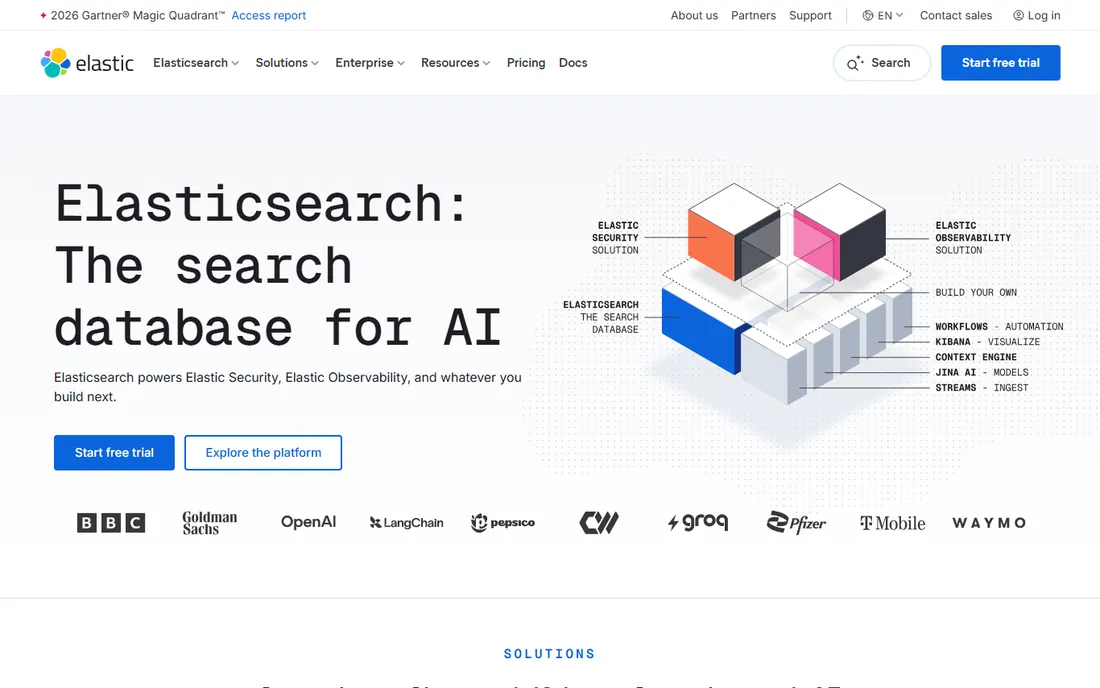
Elastic's APM lives inside Elastic Observability, which lives on Elasticsearch. That architecture is the whole pitch: one datastore for logs, metrics, traces and security data, deployable anywhere from Elastic Cloud to your own data center. The company claims 75 percent of the Fortune 100 use Elastic, and the APM supports OpenTelemetry natively.
The trade is operational. Self-managing Elasticsearch at scale is real engineering work, which is why many teams choose Elastic Cloud and let the vendor run it. Pricing for production deployments is quote-based, though a no-card free trial lets you evaluate. Pick Elastic when data control, residency or existing Elasticsearch investment decides the matter; pick a SaaS APM when you never want to think about the datastore.
What we like- Run it in Elastic Cloud, on-premises or serverless with the same stack
- APM rides on Elasticsearch, so logs, metrics and traces share one datastore
- Strong choice where data residency or self-hosting is required
Watch out for- Quote-based pricing for serious deployments
- Operating the stack yourself trades license cost for engineering time
#7
Grafana Cloud
Best for: Teams built on open standards that want to avoid vendor lock-in
Visit grafana.com
Starting priceFree tier; paid from $0.025/host hour (~$18/host/month) plus $19/month platform fee
Free planYes (free tier, no credit card)
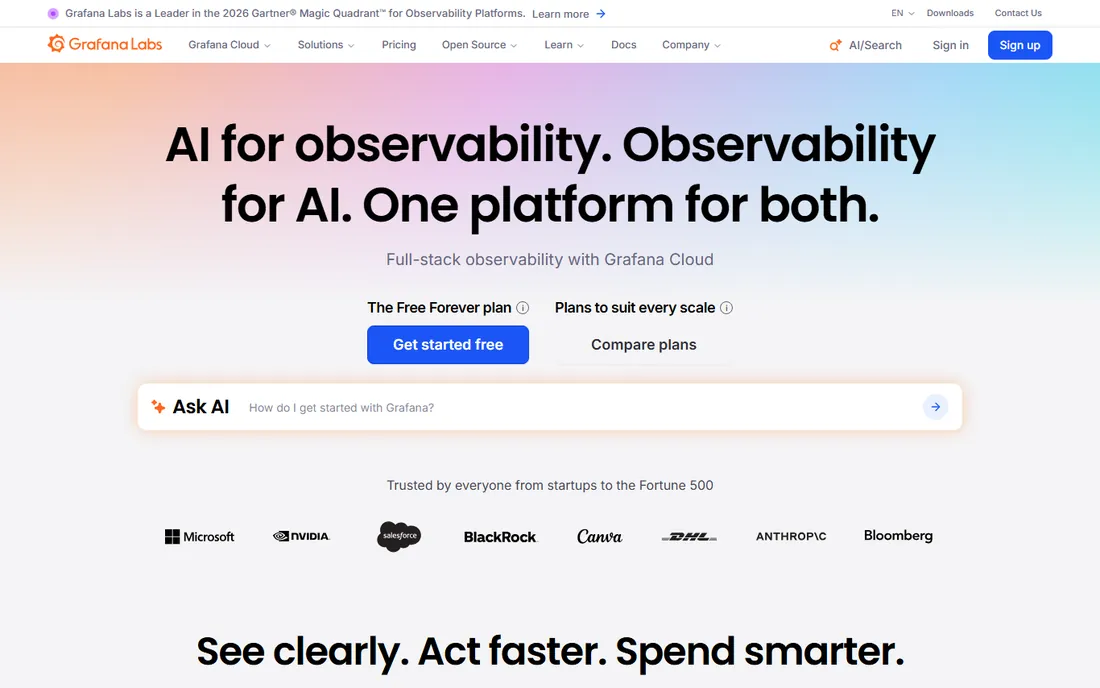
Grafana Cloud is the open answer to APM: the dashboards everyone already knows, backed by a managed telemetry platform. Application Observability starts at $0.025 per host hour (about $18/host/month) on top of a $19/month platform fee, and the free tier covers 10k active series, 50 GB of logs and traces monthly, and thousands of host hours without a credit card.
The lock-in story is the differentiator. Your dashboards, alerts and instrumentation are Prometheus and OpenTelemetry standards, portable if you ever leave. The cost is complexity: pricing spans a dozen dimensions, and teams new to observability may find Datadog's per-host simplicity easier to budget. For open-source-native teams, Grafana Cloud is the natural home.
What we like- Generous free tier across metrics, logs, traces and profiles with no card required
- OpenTelemetry and Prometheus native, with hundreds of integrations
- Usage-based pricing means you pay for telemetry, not seats
Watch out for- Pricing has many dimensions (series, GB, host hours, sessions), so modeling takes effort
- The platform assumes comfort with open-source tooling concepts
Choosing APM without overbuying
Start from the incident, not the feature list. Write down the last three production incidents and ask what would have found each faster: usually it is a trace, a log line and a deploy marker, not a new platform. If your current gap is "we cannot see what the code is doing," Sentry or Honeycomb closes it cheapest. If the gap is "we cannot see what the infrastructure is doing," Datadog or Grafana Cloud fits.
Then model the bill on your real numbers. Count hosts, estimate monthly log and trace volume, and count the engineers who need full access. Run each vendor's pricing against those three numbers, not against the headline rate. A $36/host tool is cheap at 5 hosts and brutal at 200; a $0.40/GB tool is cheap until someone enables debug logging. Finally, trial with production traffic. APM trials on staging prove nothing about cardinality, volume or cost.
APM pricing models, decoded
Three models dominate, and each punishes a different kind of growth. Per-host pricing (Datadog) is simple to forecast but taxes infrastructure growth: autoscaling events and Kubernetes churn inflate host counts. Per-event or per-GB pricing (Honeycomb, Sentry, New Relic data) taxes telemetry volume: rich instrumentation costs more, which quietly discourages the detailed data that makes debugging work. Per-user pricing (New Relic users, Grafana's platform fee structure) taxes team growth instead.
None is universally cheapest. Small host counts with chatty services favor per-host; large fleets with lean telemetry favor usage-based; growing engineering teams should watch per-user. The practical move is a 90-day review clause in the contract and a monthly usage dashboard from day one. Every one of these vendors will happily show you the dashboard; make someone on your team actually read it.
How we chose
We started with the searches buyers run: application performance monitoring tools, APM tools and best APM software. For each candidate we opened the vendor's own homepage and, where prices are published, the vendor's own pricing page, and checked positioning against public reviews on G2 and practitioner discussion on Reddit. We weighted toward tools a buyer can actually evaluate today, with transparent pricing where it exists, and we included both the full-stack platforms and the focused debugging tools because they solve different problems. Where a price could not be verified on the vendor's page we wrote "See website" rather than guessing.
Frequently asked questions
How much does APM software cost?
It depends on the model. Datadog APM starts at $36/host/month billed annually. New Relic and Grafana Cloud have free tiers, with paid usage from $0.40/GB (New Relic data) or about $18/host/month (Grafana). Sentry Team is $26/month. Honeycomb Pro starts at $3.00 per million events. Dynatrace and Elastic are quote-based. A 20-host setup typically runs $500 to $2,000 a month depending on the vendor and data volume.
What is the difference between APM and observability?
APM focuses on application performance: traces, errors, response times and code-level diagnostics. Observability is the broader practice covering metrics, logs and traces across the whole stack. Most tools on this list now sell observability platforms with APM as one capability; Sentry and Honeycomb stay closest to the application layer.
Do I need APM if I already have infrastructure monitoring?
If your incidents are "the server is down," infrastructure monitoring suffices. If they are "the checkout is slow for some users and the servers look fine," you need APM: distributed tracing shows which service, which query and which deploy caused it. Teams running microservices almost always need both.
Which APM tool is easiest to set up?
Sentry is fastest: a few lines of code and you get errors plus performance data. Grafana Cloud and New Relic are straightforward for teams already on OpenTelemetry. Datadog and Dynatrace use agents that take more setup but then cover everything. Honeycomb rewards good OpenTelemetry instrumentation with the best debugging experience.
Can I use a free APM tool in production?
Yes, within limits. New Relic's free tier (100 GB/month), Grafana Cloud's free tier and Sentry's free Developer plan all run real production workloads. They cap data volume, retention or users, so growing systems eventually pay. Starting free and upgrading when the caps bite is a sensible strategy.
Sources we checked (14)
- https://datadoghq.com/
- https://www.datadoghq.com/pricing/
- https://newrelic.com
- https://newrelic.com/pricing
- https://dynatrace.com/
- https://honeycomb.io/
- https://honeycomb.io/pricing
- https://docs.honeycomb.io/get-started/honeycomb/2026-pro-plan-changes
- https://sentry.io/
- https://sentry.io/pricing/
- https://www.elastic.co
- https://grafana.com/
- https://grafana.com/pricing/
- https://www.g2.com/categories/application-performance-monitoring-apm
Is your product missing or out of date?
We review this list regularly. Vendors can request a listing, send updated pricing or ask about featured placement.

Shihab Mia · Founder, Rankite
Shihab has spent more than a decade helping SaaS and e-commerce brands grow through search. He writes Rankite's software buying guides from pricing pages, documentation and public user reviews. More about Shihab.