How we make this list: we compare pricing pages, product documentation and public user reviews. Ratings come from G2, Capterra or Trustpilot, with the date we checked them.
Key takeaways
- Datadog and New Relic suit teams that want broad SaaS observability in one platform.
- Grafana Cloud and SigNoz suit teams that want open-source stacks and OpenTelemetry support.
- Splunk and IBM Instana suit enterprises with log, security, or automated APM needs.
- Honeycomb suits debugging high-cardinality distributed requests, rather than broad infrastructure monitoring.
Quick comparison
| Tool | Best for | Starting price | Free plan |
|---|
 Datadog | Broad all-in-one observability | $15 per host/month | Free trial |
 New Relic | Full-stack observability with free data tier | See website | Yes |
 Grafana Cloud | Open-source observability stack in cloud | $19 per month | Yes |
 Splunk Observability Cloud | Enterprise observability plus security | See website | Free trial |
 IBM Instana | Automated APM with real-time mapping | $20 per host/month | Free trial |
 LogicMonitor | Hybrid infrastructure monitoring | See website | Free trial |
 Elastic Observability | Log-heavy observability on Elasticsearch | See website | Free trial |
 Honeycomb | High-cardinality debugging | See website | Yes |
 SigNoz | Open-source full-stack observability | See website | Yes |
Is your product missing or out of date?
We review this list regularly. Vendors can request a listing, send updated pricing or ask about featured placement.
The best dynatrace alternatives
#1Datadog
Best for: Broad all-in-one observability4.4/5 on
G2 (726 reviews, checked Oct 2026)
Visit datadoghq.com
Starting price$15 per host/month
Free planFree trial
For teams that need broad SaaS observability, this is a practical place to start. Datadog is a broad SaaS observability platform for cloud-native teams that want infrastructure, APM, and logs together. Its integration list is wide, but teams should model log and metric volume before committing, because usage pricing can rise fast.
In daily use, the deciding factors are usually Broad all-in-one observability, how the tool handles your existing stack, and whether the plan limits match your volume. Check the pricing page, the documentation for Datadog, and recent public reviews before you buy, and use a trial with a real project rather than a demo dataset. Pricing and plan limits are worth checking on the vendor pricing page before you commit, because tiers and add-ons change over time. If the tool fits your main workflow and its limits are acceptable, it is worth a shortlist spot. If not, move to the next option in this guide.
What we like- Infrastructure, APM, logs, and synthetics in one platform
- Many integrations
- Strong dashboards
Watch out for- Costs can grow with usage
- Pricing needs careful modeling
#2New Relic
Best for: Full-stack observability with free data tier4.4/5 on
G2 (586 reviews, checked Oct 2026)
Visit newrelic.com
Starting priceSee website
Free planYes
If your main problem is full-stack SaaS with a free tier, this option deserves a close look. New Relic offers full-stack observability with a free monthly data allowance that suits smaller teams. It is a good starting point for teams that want APM and infrastructure in one SaaS, while larger teams should check user and data pricing.
In daily use, the deciding factors are usually Full-stack observability with free data tier, how the tool handles your existing stack, and whether the plan limits match your volume. Check the pricing page, the documentation for New Relic, and recent public reviews before you buy, and use a trial with a real project rather than a demo dataset. Pricing and plan limits are worth checking on the vendor pricing page before you commit, because tiers and add-ons change over time. If the tool fits your main workflow and its limits are acceptable, it is worth a shortlist spot. If not, move to the next option in this guide.
What we like- Full-stack APM, logs, and infrastructure
- Free monthly data allowance
- Query language for analysis
Watch out for- Per-user fees on paid tiers
- Learning curve for query language
#3Grafana Cloud
Best for: Open-source observability stack in cloud4.5/5 on
G2 (220 reviews, checked Oct 2026)
Visit grafana.com
Starting price$19 per month
Free planYes
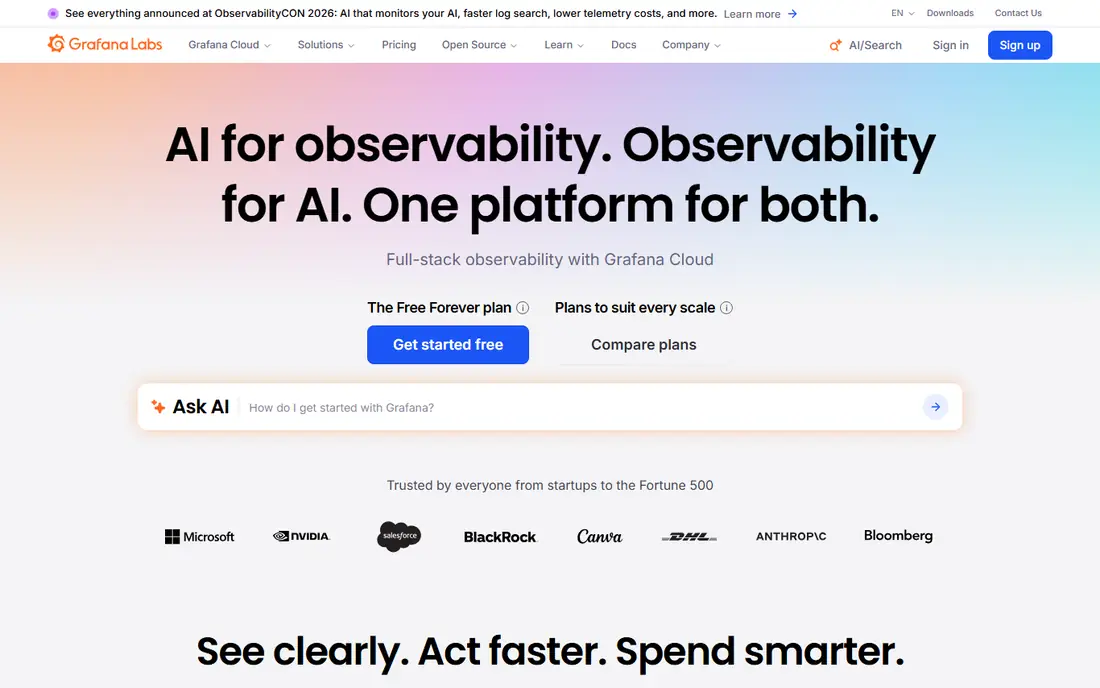
This option suits groups that want an open-source cloud stack without a long setup. Grafana Cloud hosts the popular open-source observability stack, with dashboards that combine many data sources. It suits teams invested in Prometheus and open standards, while teams that want a single vendor agent may prefer Datadog or New Relic.
In daily use, the deciding factors are usually Open-source observability stack in cloud, how the tool handles your existing stack, and whether the plan limits match your volume. Check the pricing page, the documentation for Grafana Cloud, and recent public reviews before you buy, and use a trial with a real project rather than a demo dataset. Pricing and plan limits are worth checking on the vendor pricing page before you commit, because tiers and add-ons change over time. If the tool fits your main workflow and its limits are acceptable, it is worth a shortlist spot. If not, move to the next option in this guide.
What we like- Prometheus, Loki, and Tempo stack
- Flexible dashboards
- Open-source roots
Watch out for- Self-managed complexity if you run it yourself
- Pricing by usage metrics
#4Splunk Observability Cloud
Best for: Enterprise observability plus security4.3/5 on
G2 (55 reviews, checked Oct 2026)
Visit splunk.com
Starting priceSee website
Free planFree trial
When enterprise log and security observability matters more than extra features, this tool fits well. Splunk Observability Cloud suits enterprises that already use Splunk for logs and security. Its depth in log analysis is a strength, but cost and setup make it a poor fit for small teams.
In daily use, the deciding factors are usually Enterprise observability plus security, how the tool handles your existing stack, and whether the plan limits match your volume. Check the pricing page, the documentation for Splunk Observability Cloud, and recent public reviews before you buy, and use a trial with a real project rather than a demo dataset. Pricing and plan limits are worth checking on the vendor pricing page before you commit, because tiers and add-ons change over time. If the tool fits your main workflow and its limits are acceptable, it is worth a shortlist spot. If not, move to the next option in this guide.
What we like- Strong log and security analytics
- Enterprise scale
- Broad integrations
Watch out for- Enterprise pricing
- Complexity for small teams
#5IBM Instana
Best for: Automated APM with real-time mapping4.4/5 on
G2 (481 reviews, checked Oct 2026)
Visit ibm.com
Starting price$20 per host/month
Free planFree trial
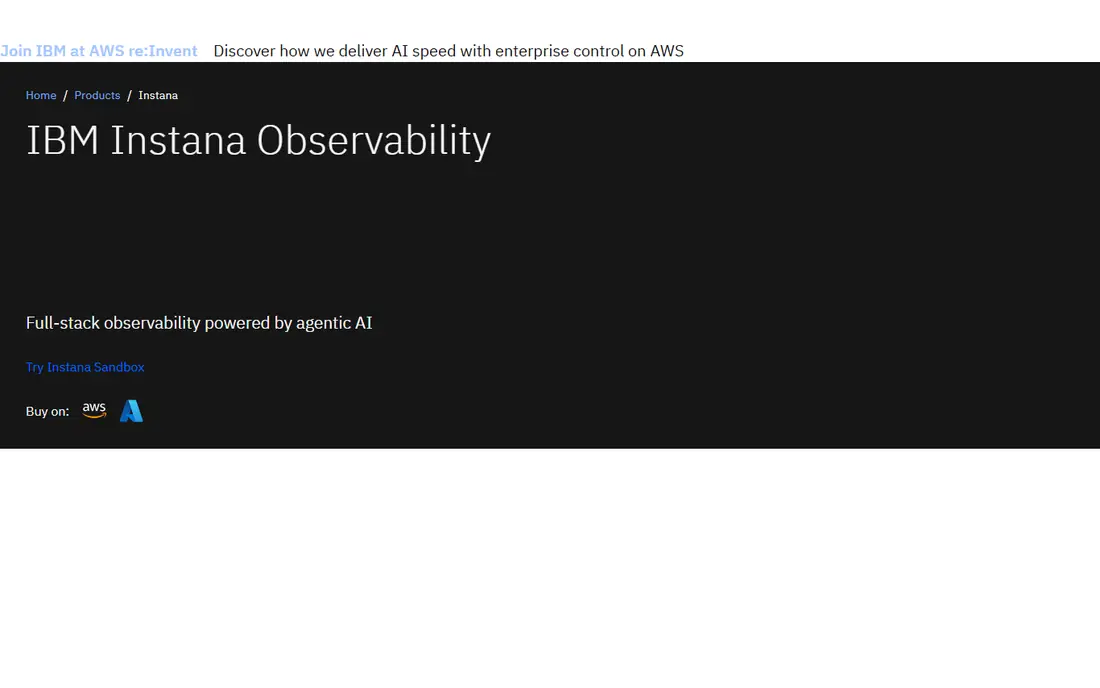
A good pick for people who put automated APM mapping first is this platform. IBM Instana is built for automated APM, with real-time service maps and tracing for microservices. It suits teams that want fast setup and automated discovery, especially in IBM environments.
In daily use, the deciding factors are usually Automated APM with real-time mapping, how the tool handles your existing stack, and whether the plan limits match your volume. Check the pricing page, the documentation for IBM Instana, and recent public reviews before you buy, and use a trial with a real project rather than a demo dataset. Pricing and plan limits are worth checking on the vendor pricing page before you commit, because tiers and add-ons change over time. If the tool fits your main workflow and its limits are acceptable, it is worth a shortlist spot. If not, move to the next option in this guide.
What we like- Automated discovery and service maps
- Real-time tracing
- AI-assisted root cause
Watch out for- Minimum host counts on some plans
- IBM ecosystem focus
#6LogicMonitor
Best for: Hybrid infrastructure monitoring4.5/5 on
G2 (643 reviews, checked Oct 2026)
Visit logicmonitor.com
Starting priceSee website
Free planFree trial
Consider this tool when hybrid infrastructure monitoring is the deciding factor. LogicMonitor focuses on infrastructure monitoring across hybrid environments, with alerting for operations teams. It suits teams that manage servers, networks, and cloud resources together, while APM-heavy teams may need a second tool.
In daily use, the deciding factors are usually Hybrid infrastructure monitoring, how the tool handles your existing stack, and whether the plan limits match your volume. Check the pricing page, the documentation for LogicMonitor, and recent public reviews before you buy, and use a trial with a real project rather than a demo dataset. Pricing and plan limits are worth checking on the vendor pricing page before you commit, because tiers and add-ons change over time. If the tool fits your main workflow and its limits are acceptable, it is worth a shortlist spot. If not, move to the next option in this guide.
What we like- Hybrid cloud and on-prem monitoring
- Agentless options
- Intelligent alerting
Watch out for- Less deep APM than specialists
- Pricing quoted
#7
Elastic Observability
Best for: Log-heavy observability on Elasticsearch
Visit elastic.co
Starting priceSee website
Free planFree trial
This platform works best where log-heavy Elasticsearch observability is the daily work. Elastic Observability is built on Elasticsearch and suits log-heavy teams with search and analysis needs. It offers self-managed, hosted, and serverless options, but teams need Elasticsearch experience to run it well.
In daily use, the deciding factors are usually Log-heavy observability on Elasticsearch, how the tool handles your existing stack, and whether the plan limits match your volume. Check the pricing page, the documentation for Elastic Observability, and recent public reviews before you buy, and use a trial with a real project rather than a demo dataset. Pricing and plan limits are worth checking on the vendor pricing page before you commit, because tiers and add-ons change over time. If the tool fits your main workflow and its limits are acceptable, it is worth a shortlist spot. If not, move to the next option in this guide.
What we like- Elasticsearch-based logs, metrics, and traces
- Flexible deployment
- Strong search
Watch out for- Needs Elasticsearch skills
- Cost modeling for ingest and retention
#8Honeycomb
Best for: High-cardinality debugging4.5/5 on
G2 (37 reviews, checked Oct 2026)
Visit honeycomb.io
Starting priceSee website
Free planYes
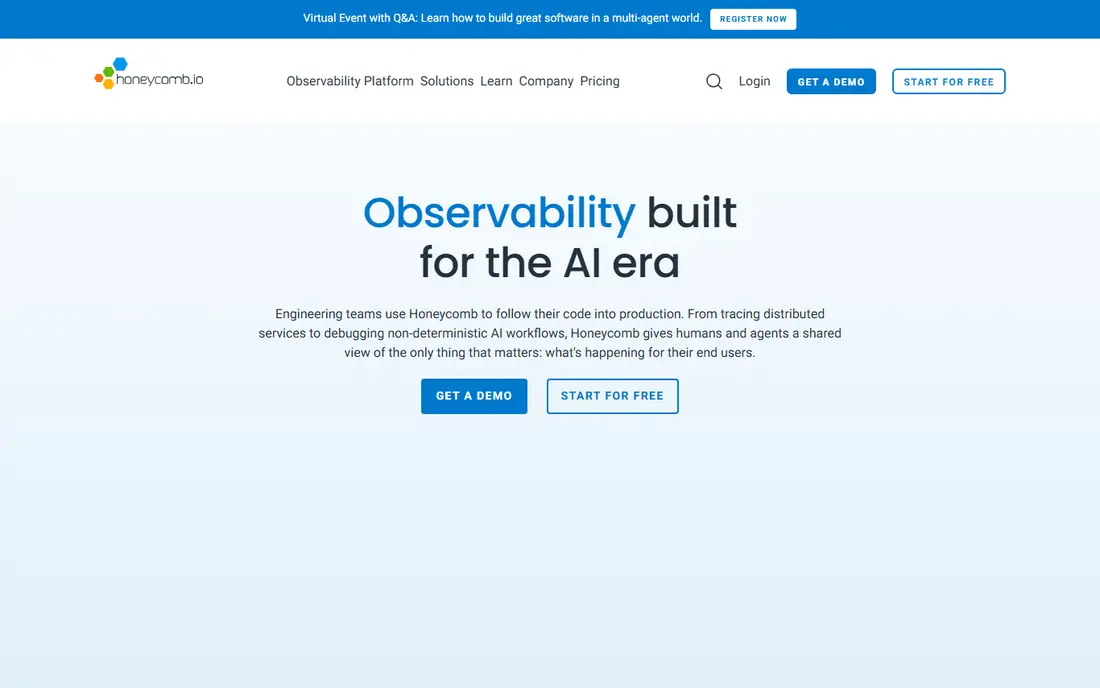
For a setup built around high-cardinality debugging, this is a strong candidate. Honeycomb is built for debugging distributed systems with high-cardinality events. It suits teams that debug complex requests across services, while teams needing broad infrastructure monitoring may pair it with another tool.
In daily use, the deciding factors are usually High-cardinality debugging, how the tool handles your existing stack, and whether the plan limits match your volume. Check the pricing page, the documentation for Honeycomb, and recent public reviews before you buy, and use a trial with a real project rather than a demo dataset. Pricing and plan limits are worth checking on the vendor pricing page before you commit, because tiers and add-ons change over time. If the tool fits your main workflow and its limits are acceptable, it is worth a shortlist spot. If not, move to the next option in this guide.
What we like- High-cardinality event analysis
- Fast debugging queries
- OpenTelemetry support
Watch out for- Event-based pricing needs modeling
- Less broad infrastructure coverage
Starting priceSee website
Free planYes
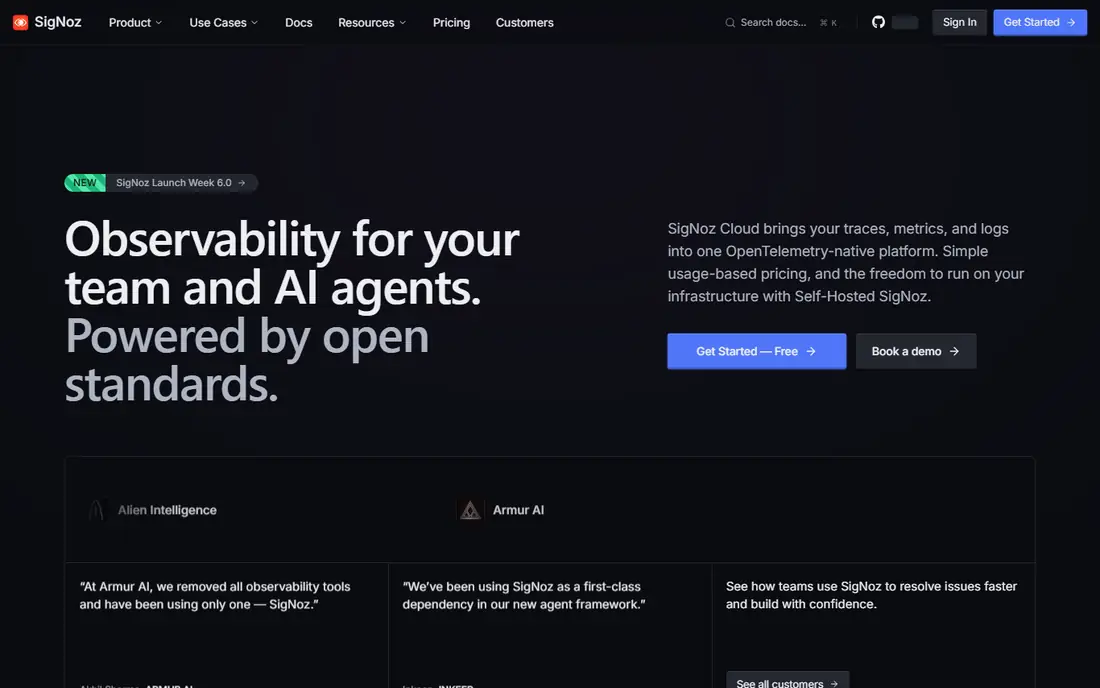
If you value open-source full-stack observability above all else, start your shortlist here. SigNoz is an open-source observability platform with APM, logs, and metrics in one system. It suits teams that want open-source control and OpenTelemetry support without per-user fees, while operations work falls to your team if self-hosted.
In daily use, the deciding factors are usually Open-source full-stack observability, how the tool handles your existing stack, and whether the plan limits match your volume. Check the pricing page, the documentation for SigNoz, and recent public reviews before you buy, and use a trial with a real project rather than a demo dataset. Pricing and plan limits are worth checking on the vendor pricing page before you commit, because tiers and add-ons change over time. If the tool fits your main workflow and its limits are acceptable, it is worth a shortlist spot. If not, move to the next option in this guide.
What we like- Open-source APM, logs, and metrics
- ClickHouse backend
- OpenTelemetry native
Watch out for- Self-hosting needs operations work
- Smaller ecosystem than large vendors
How we chose
We compared pricing pages, product documentation, and public reviews on G2, Capterra, and Reddit, then checked features, integrations, and fit for different company sizes. We did not count marketing claims as facts, and we left a price as See website when the vendor page did not publish a clear starting price.
That method favors tools with clear documentation and a plan that matches the job. A large platform can still be the wrong pick for a small team, and a small tool can still be the right pick for a focused job, so size fit mattered as much as feature count.
List signals, then model volume
Decide whether you need infrastructure metrics, APM traces, logs, synthetic checks, and real user monitoring. Then estimate hosts, services, log volume, and retention. That model matters more than the starting price, because usage fees drive the total cost for most SaaS tools.
Standardize on OpenTelemetry where you can
OpenTelemetry lets you send traces, metrics, and logs to different backends without re-instrumenting every service. That flexibility makes switching vendors easier later. Check each tool's OpenTelemetry support and how much vendor-specific agent work remains.
Run a pilot on real traffic
Instrument one service or one team first, and compare alert quality, query speed, and dashboard use. Check how long it takes to find a root cause for a real incident. A pilot reveals pricing, usability, and gaps that a sales demo will not show.
Frequently asked questions
What is the best overall Dynatrace alternative?
There is no single best pick. Datadog suits broad SaaS coverage, New Relic suits teams that want a free data tier, and Grafana Cloud suits open-source teams. Pick based on signals, scale, and budget, not on a general ranking.
Can open-source observability replace Dynatrace?
Yes, for teams with operations capacity. Grafana Cloud and SigNoz cover metrics, logs, and traces, but self-hosted setups need your team to run, upgrade, and scale the stack.
Why are observability bills hard to predict?
Bills depend on ingest volume, metric cardinality, log retention, and host count. A small change in log volume or retention can change the bill a lot, so model those numbers before you commit.
Do I need APM, or is infrastructure monitoring enough?
Infrastructure monitoring shows host and service health. APM shows request traces across services, which you need to debug slow or failing requests in microservices. Most teams that run microservices need both.
How long should a trial last?
A trial should cover at least one real incident or deployment cycle. That gives you time to check alerts, query speed, and dashboard use under normal and incident conditions.
Sources we checked (9)
- https://www.datadoghq.com/pricing/
- https://newrelic.com/pricing
- https://grafana.com/pricing/
- https://www.splunk.com/en_us/products/observability-cloud.html
- https://www.ibm.com/products/instana/pricing
- https://www.logicmonitor.com/pricing
- https://www.elastic.co/pricing
- https://www.honeycomb.io/pricing
- https://signoz.io/pricing/
Is your product missing or out of date?
We review this list regularly. Vendors can request a listing, send updated pricing or ask about featured placement.

Shihab Mia · Founder, Rankite
Shihab has 5+ years in B2B and SaaS SEO. He writes Rankite's software buying guides from pricing pages, documentation and public user reviews. More about Shihab.