How we make this list: we compare pricing pages, product documentation and public user reviews. Rankite is independent; if a vendor ever pays for a featured spot, that listing is clearly labeled Partner.
Key takeaways
- Datadog ($15/host/month) and New Relic (free 100 GB/month, then $0.40/GB) lead for cloud teams, but their bills scale with usage in ways that surprise first-time buyers.
- PRTG ($200/month), Zabbix (free) and Nagios XI remain the practical choices for traditional IT shops monitoring servers and networks on-premise.
- Site24x7 ($9/month, 30-day trial) is the cheapest credible all-rounder for small businesses that need website, server and app monitoring in one place.
- Open-source options (Zabbix, Nagios Core) cost nothing in licenses but demand real engineering time; factor that in before calling them free.
Quick comparison
| Tool | Best for | Starting price | Free plan |
|---|
 Datadog Datadog | cloud-native teams wanting one observability platform | $15/host/month (billed annually) | Free trial (14 days) |
 New Relic New Relic | teams that prefer usage-based pricing over per-host | Free tier; $0.40/GB beyond 100 GB/mo | Yes |
 Dynatrace Dynatrace | large enterprises wanting automated root-cause analysis | See website | Free trial (15 days) |
 PRTG Network Monitor PRTG Network Monitor | IT teams monitoring networks and servers on-premise | $200/month (billed annually) | Yes |
 Zabbix Zabbix | budget-conscious teams with engineering capacity | See website | Yes |
 Nagios XI Nagios XI | traditional IT shops wanting proven infrastructure monitoring | See website | Yes |
 SolarWinds SolarWinds | enterprises already invested in the Orion platform | See website | Free trial |
 ManageEngine OpManager ManageEngine OpManager | Windows-centric IT departments wanting value | See website | Free trial (30 days) |
 LogicMonitor LogicMonitor | hybrid IT environments wanting automated setup | See website | No |
 Site24x7 Site24x7 | small businesses needing affordable all-in-one monitoring | $9/month | Free trial (30 days) |
Is your product missing or out of date?
We review this list regularly. Vendors can request a listing, send updated pricing or ask about featured placement.
The best system monitoring software
Starting price$15/host/month (billed annually)
Free planFree trial (14 days)
Datadog is the default answer in cloud-native companies, and its pricing page explains both why and why not. The platform unifies infrastructure monitoring, application performance monitoring, log management, real user monitoring, synthetics and security in one interface with more than a thousand integrations. When everything feeds one system, correlating a latency spike with a deploy and the relevant logs takes minutes.
Infrastructure monitoring starts at $15 per host per month with an annual commitment, and that is only the beginning: APM, logs, RUM and synthetics are separate products with separate meters. A 14-day free trial gives full access, which is genuinely useful for evaluation. The Watchdog AI flags anomalies without manual threshold tuning, a real time saver at scale.
The honest catch is the bill. Datadog is famous for invoices that surprise finance teams, because hosts, ingested log gigabytes, custom metrics and indexed spans all meter independently. Cost control becomes a discipline of its own. For funded startups and enterprises with real cloud footprints, Datadog is the best pc performance monitoring software at scale in the sense that matters: it monitors everything. For small teams, start with the trial and model costs carefully before committing.
What we like- 1,000-plus integrations covering nearly every stack
- Unified platform for infra, APM, logs, RUM and security
- Generous 14-day full-feature trial
Watch out for- Per-product pricing gets complex and bills can balloon
- Costs scale with hosts, logs and custom metrics simultaneously
#2
New Relic
Best for: teams that prefer usage-based pricing over per-host
Visit newrelic.com
Starting priceFree tier; $0.40/GB beyond 100 GB/mo
Free planYes
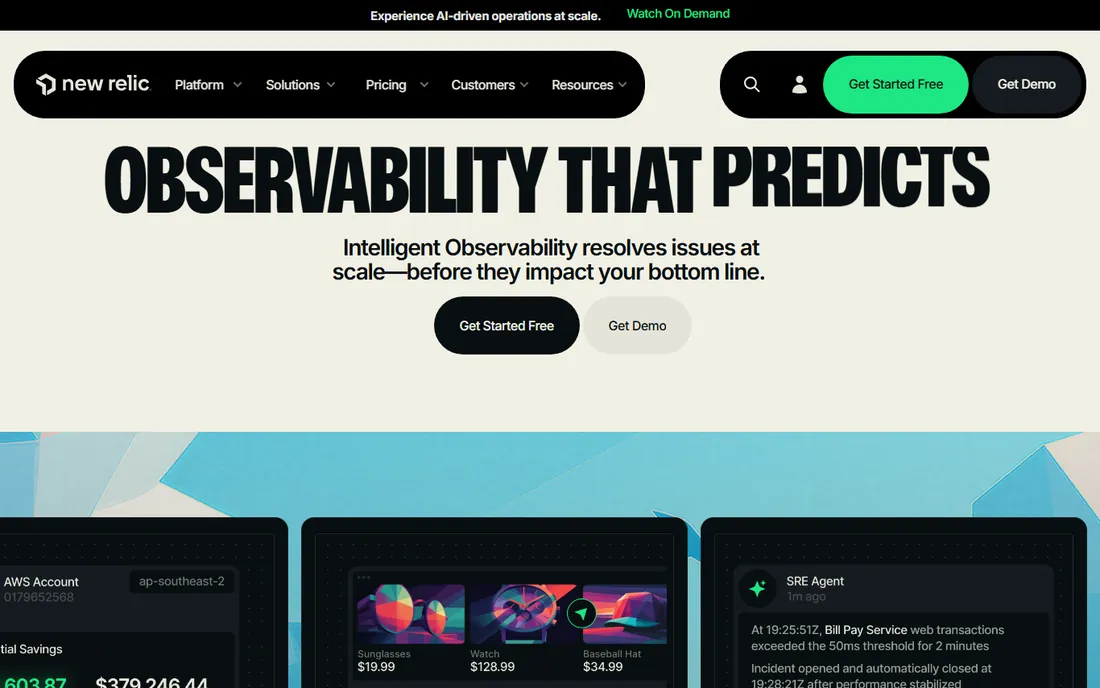
New Relic rebuilt its pricing around a simple idea: stop counting hosts. Instead of Datadog's per-host meters, you pay for data ingested and users, with unlimited hosts, containers and agents included. The free tier is the most generous in the industry: 100 GB of data ingest per month, one full platform user with access to all 50-plus capabilities, and unlimited basic users, no credit card required.
Paid pricing is public and straightforward. Beyond the free 100 GB, data costs $0.40 per GB per month ($0.60 with the Data Plus option for extended retention and compliance features). User pricing starts at $49 per core user per month, with full platform users from $10 for the first user on Standard. That transparency makes budgeting far easier than with host-based competitors.
The trade-off is the user meter. A 50-person engineering org pays per-user fees that a host-based tool would not charge, so the math favors small teams and disfavors large ones. Data discipline also matters: undisciplined log ingestion burns through the free 100 GB fast. For startups and mid-size teams that want the best monitoring software for pc and cloud infrastructure without per-host anxiety, New Relic's free tier is the best starting point in this category.
What we like- Genuinely generous free tier (100 GB/month, full platform user)
- Simple two-metric pricing (users plus data)
- Unlimited hosts at no extra cost
Watch out for- Per-user fees add up as engineering teams grow
- Advanced features like Data Plus raise the data rate
#3
Dynatrace
Best for: large enterprises wanting automated root-cause analysis
Visit dynatrace.com
Starting priceSee website
Free planFree trial (15 days)
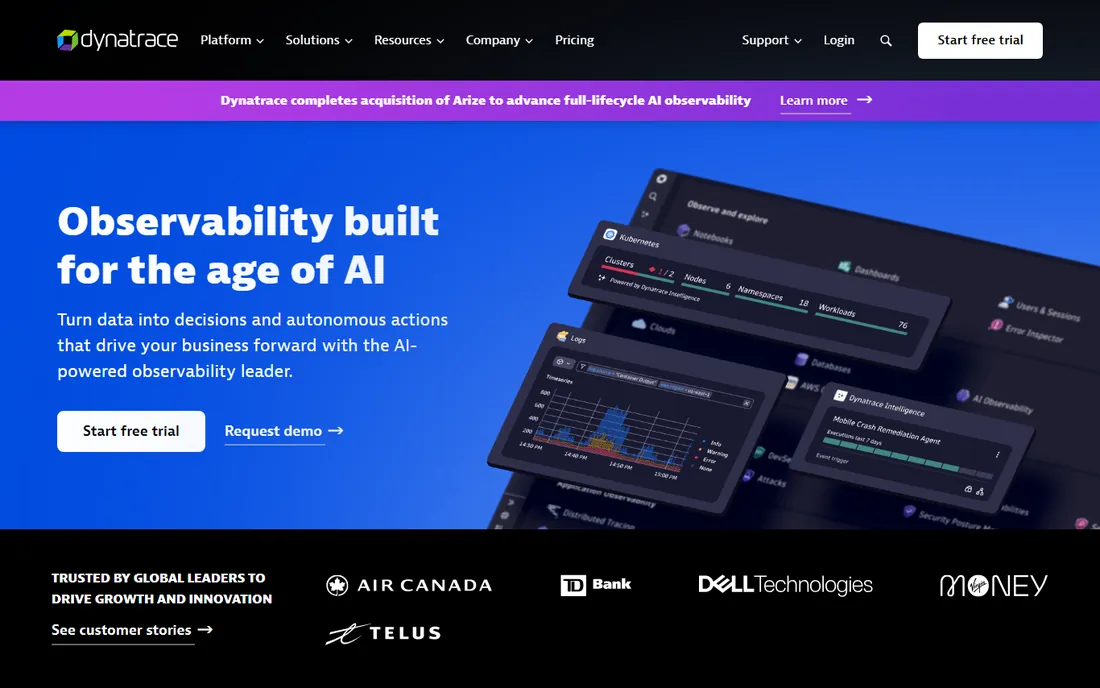
Dynatrace sells certainty: automatic discovery, automatic baselining, automatic root cause. You install the OneAgent, and it maps your entire application topology, learns normal behavior and tells you not just that something broke but why. The Davis AI engine performs causal analysis rather than simple correlation, which is why large enterprises with complex estates swear by it.
The platform covers full-stack observability: infrastructure, applications, logs, real user monitoring, synthetics and security, deployable as SaaS or self-managed for data-sovereignty requirements. A 15-day free trial with 1,000 trial hours lets you evaluate against real workloads. Pricing runs roughly $0.08 per hour per 8 GiB host for full-stack monitoring by third-party reports, but the official figure comes from sales.
The catch is fit. Dynatrace is built for large, complex environments; a ten-server shop will pay enterprise prices for automation it barely needs. There is no public pricing and no self-serve path beyond the trial. If you run a large estate and your team spends its weeks chasing root causes manually, Dynatrace pays for itself. Everyone else should look at Datadog, New Relic or Site24x7 first.
What we like- Automatic discovery and topology mapping with minimal config
- Davis AI for causal root-cause analysis
- 15-day free trial with generous trial hours
Watch out for- No public pricing, enterprise sales motion
- Can be overkill and overpriced for small environments
#4
PRTG Network Monitor
Best for: IT teams monitoring networks and servers on-premise
Visit paessler.com
Starting price$200/month (billed annually)
Free planYes
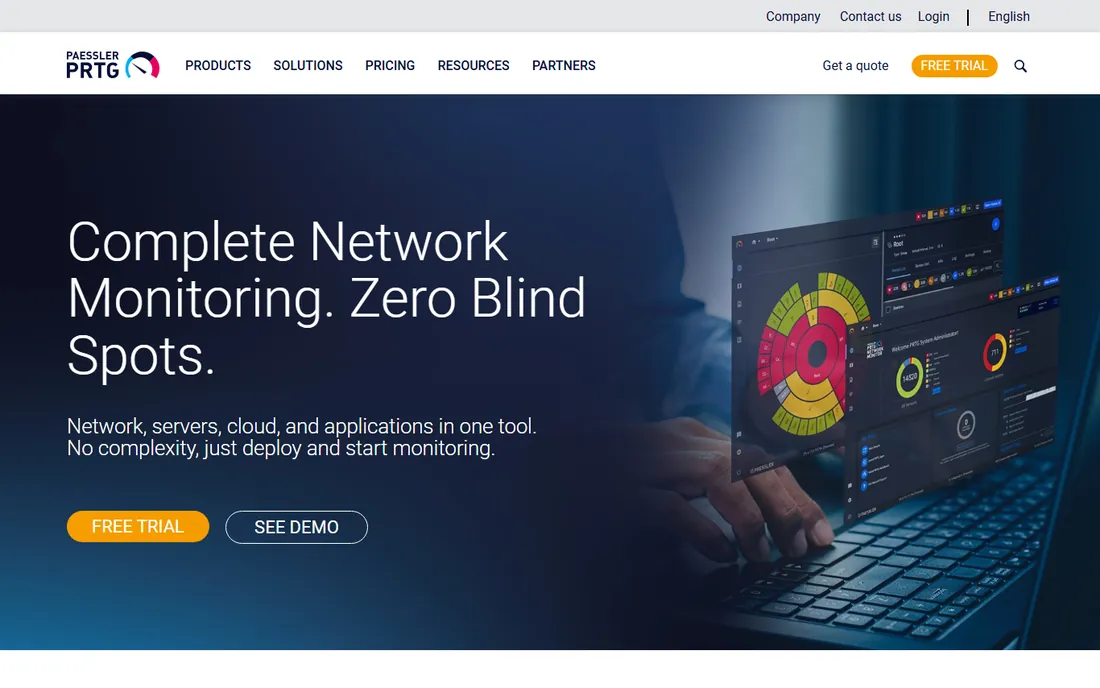
PRTG is the German-engineered alternative for teams that monitor networks, not just cloud apps. Developed by Paessler since 2003, it watches bandwidth, servers, applications, virtual environments and IoT devices through a sensor model: each thing you measure is a sensor, and you buy a license sized to your sensor count. That model is refreshingly concrete compared to per-GB or per-host abstractions.
Pricing is public. The PRTG 500 license (500 sensors, about 50 devices) runs $200 per month billed annually, scaling to PRTG 10000 for very large environments. A freeware edition covers 100 sensors indefinitely, and every paid license starts with an unrestricted 30-day trial. Out-of-the-box support for SNMP, NetFlow, packet sniffing, WMI and 200-plus prebuilt sensor types means network teams are productive fast.
The honest weaknesses: the sensor model punishes environments with many metrics per device, alert noise is a common complaint, and third-party integrations lag behind cloud-native competitors. The interface, while improved, still feels like traditional IT software. For on-premise Windows and network-heavy shops, PRTG remains one of the best pc system monitoring software choices for the money.
What we like- Sensor-based model is easy to understand and budget
- Freeware edition covers 100 sensors
- Strong out-of-the-box network monitoring (SNMP, NetFlow, WMI)
Watch out for- Windows-centric heritage shows in places
- Sensor counting punishes chatty environments
#5
Zabbix
Best for: budget-conscious teams with engineering capacity
Visit zabbix.com
Starting priceSee website
Free planYes
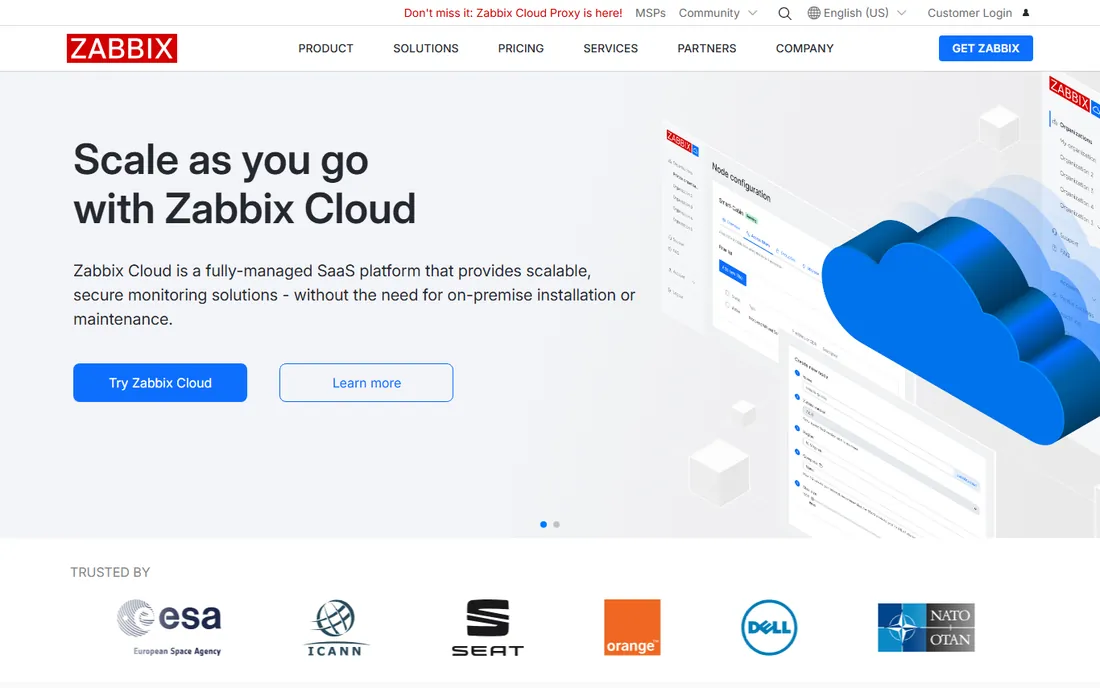
Zabbix is free, open source, and more capable than most paid tools; it just asks for your time instead of your money. The Latvian project, active since 2001, monitors networks, servers, applications and cloud services with agent-based and agentless methods, and its template library covers a huge range of devices and software out of the box.
There is no license fee, no sensor count and no data cap. Zabbix Cloud exists for teams that want it managed, with a free trial, but self-hosting is the norm. For enterprises on a budget, it delivers monitoring that rivals tools costing six figures, with high availability, distributed monitoring and serious scalability.
The price is expertise. Setup, tuning, upgrades and troubleshooting are your team's job, community forums are the typical support channel, and the learning curve is real. The interface has improved but still feels utilitarian next to Datadog or PRTG. If you have engineers who know monitoring, Zabbix is the best value in this entire list. If you do not, the "free" tool will cost you in consulting or staff time.
What we like- Completely free and open source with no feature gates
- Extremely flexible, monitors practically anything with an IP
- Huge template library and community
Watch out for- Steep learning curve and real maintenance burden
- Interface and UX trail commercial tools
#6
Nagios XI
Best for: traditional IT shops wanting proven infrastructure monitoring
Visit nagios.com
Starting priceSee website
Free planYes
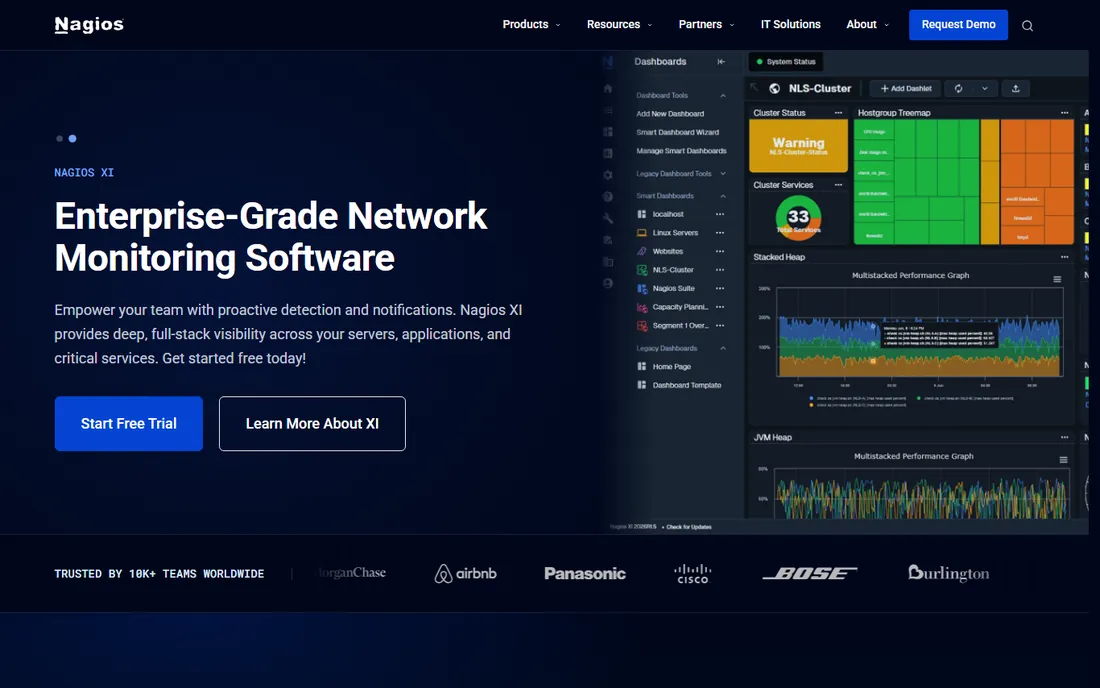
Nagios is the grandparent of infrastructure monitoring, and XI is its commercial grown-up version. Nagios Core has been the open-source standard since the early 2000s, with thousands of community plugins covering every device imaginable. Nagios XI wraps that engine in a web interface, configuration wizards, dashboards and support.
Licensing is node-based: a node is any unique IP or URL, and plans scale with your node count. The vendor offers a free option suited to home labs, trials and students, plus an Enterprise add-on for scheduled reporting and capacity planning. Maintenance and support for the first year are bundled with a license purchase.
The frustrations are well documented. Pricing is not published on the website, the architecture shows its age next to modern SaaS tools, and alert configuration can be fiddly. Many teams run Nagios Core free and never pay, which is fine but means going without XI's conveniences. For traditional IT departments that already know Nagios, XI is the low-risk commercial path. New teams should compare it honestly against Zabbix and PRTG first.
What we like- Industry-standard monitoring with decades of plugin ecosystem
- Node-based licensing is simple
- Free option for small setups and learning
Watch out for- Pricing not published on the site
- Interface and architecture feel dated
- XI is commercial while Core remains free
Starting priceSee website
Free planFree trial
SolarWinds is the incumbent in traditional IT shops, for better and for worse. The Orion platform's modules cover network performance, server and application monitoring, storage, virtualization and more, with the kind of depth that only decades of enterprise focus produces. If your environment is Windows-heavy, on-premise and complex, SolarWinds probably already monitors something like it.
The ecosystem is the argument: thousands of enterprises run it, the Thwack community is active, and integrations across the modules are tight. Free trials are available for evaluation. For organizations already on Orion, adding modules is usually cheaper and easier than ripping out the platform.
The case against is also well known. Pricing is quote-based with no public figures, the platform can be complex to operate, and the 2020 supply-chain attack permanently raised the diligence bar for security-conscious buyers. New buyers should evaluate with eyes open and compare total cost against Datadog or Dynatrace. But for the traditional enterprise IT profile, SolarWinds remains a serious contender.
What we like- Deep, mature toolset for network and systems management
- Huge installed base means answers exist for every problem
- Free trials available
Watch out for- Quote-based pricing with no public figures
- Platform complexity and past security incidents weigh on evaluations
Starting priceSee website
Free planFree trial (30 days)
ManageEngine OpManager is the value pick for Windows-centric IT departments. The Indian vendor, part of Zoho, has spent decades building IT management software that undercuts Western competitors on price while covering the fundamentals well: network, server, virtualization and storage monitoring with automated discovery, alerting and reporting.
The licensing model is buyer-friendly: it is device-based, so you can monitor any number of interfaces, disk volumes and sensors on each licensed device. That removes the sensor-counting anxiety of PRTG and the per-GB anxiety of cloud tools. A 30-day free trial of the full product lets you evaluate properly, and the vendor claims over 9,000 businesses use it.
The annoyances: exact pricing is difficult to confirm without talking to sales, and the interface packs a lot of density into every screen, which some admins love and others tolerate. For organizations already in the Zoho/ManageEngine ecosystem, OpManager integrates naturally with ServiceDesk Plus and the rest. As a best pc system monitoring software candidate for traditional IT on a budget, it deserves a trial alongside PRTG.
What we like- Device-based licensing covers unlimited interfaces and sensors per device
- Strong value for money
- 30-day free trial of the full product
Watch out for- Published pricing is hard to pin down
- Interface carries the classic ManageEngine density
Starting priceSee website
Free planNo
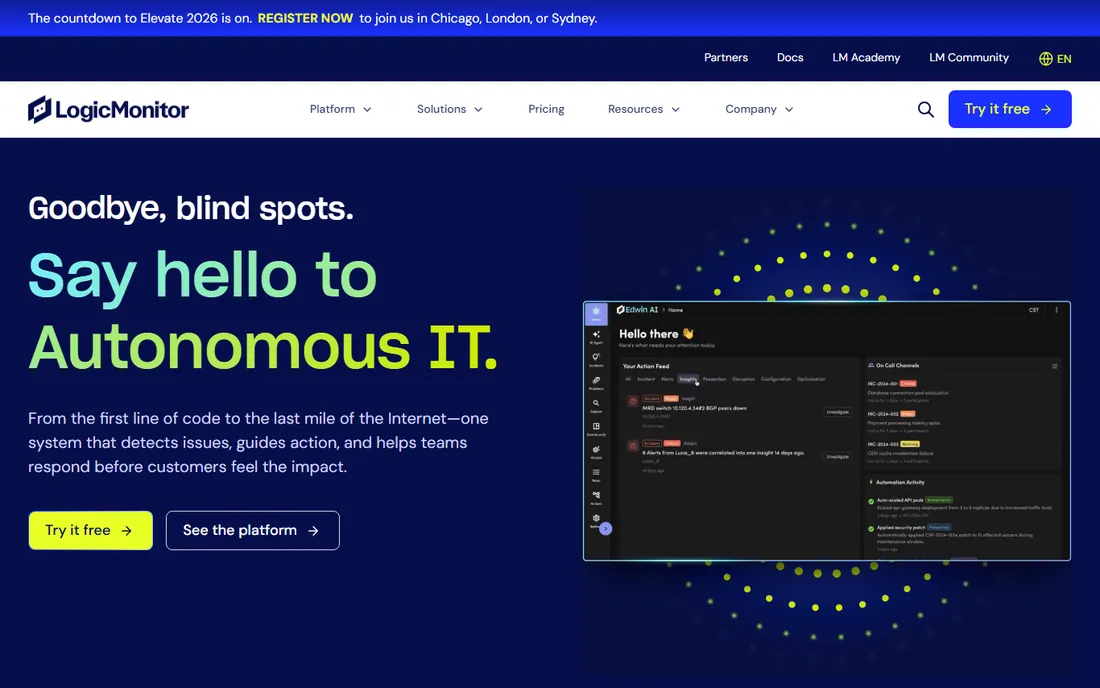
LogicMonitor pitches itself as the monitoring platform that configures itself. Founded in 2008, its LM Envision platform auto-discovers devices across cloud, on-premise and network environments, applies prebuilt monitoring templates, and uses AI for anomaly detection and forecasting. The promise is less time writing monitoring configs and more time acting on results.
The platform covers the full hybrid estate from one interface, which suits organizations straddling data centers and multiple clouds. Service-level reporting and capacity forecasting help IT leaders plan rather than react. Third-party comparisons generally place entry pricing in the tens of dollars per month range, but official figures come from sales.
The gaps: there is no public pricing and no free trial, only demos, which makes evaluation slower than Datadog or New Relic. Brand recognition trails the big three, which matters for hiring and community support. For hybrid IT teams frustrated with maintaining monitoring configs across environments, LogicMonitor's automation is worth a demo.
What we like- Automatic discovery with prebuilt monitoring templates
- AI-driven anomaly detection and forecasting
- Single pane for cloud, on-prem and network
Watch out for- Custom pricing with no public figures and no free trial
- Less brand recognition than the big three
#10
Site24x7
Best for: small businesses needing affordable all-in-one monitoring
Visit site24x7.com
Starting price$9/month
Free planFree trial (30 days)
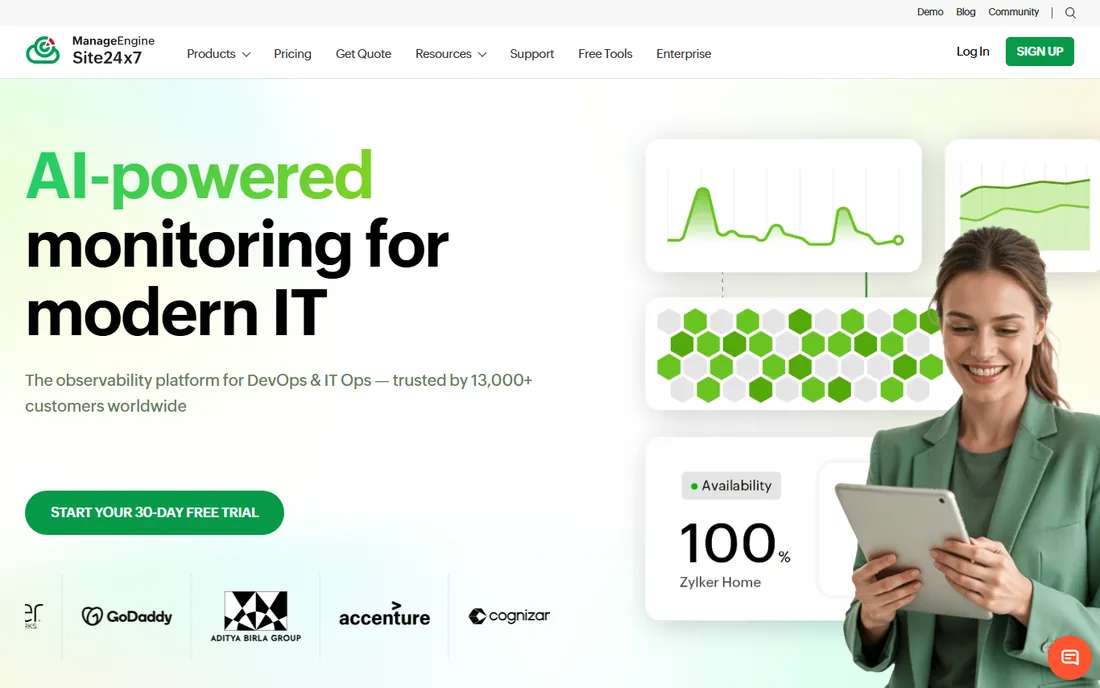
Site24x7 is the budget all-rounder from Zoho, and the price is the headline. Plans start at $9 per month, covering website uptime, server monitoring, network monitoring, APM, log management and real user monitoring from 130-plus global locations. For a small business that needs the full stack monitored without an enterprise budget, nothing else on this list comes close on price.
The 30-day free trial requires no credit card, and the monitor-based licensing (basic, host and advanced monitors) is easy to understand. The mobile app is genuinely useful for on-call admins, and AI-powered alerting helps cut noise. Annual billing shaves another 10 percent.
The ceiling is real: large enterprises will find the advanced analytics, customization and scale limits constraining, and the UI can lag with big datasets. But that is not the buyer here. For SMBs, agencies managing client sites and startups that need the best monitoring software for pc fleets, servers and websites at a price finance will not question, Site24x7 is the obvious first trial.
What we like- Plans from $9/month, the cheapest credible option here
- Covers website, server, network, APM and RUM in one
- 30-day trial with no credit card
Watch out for- Limited enterprise-scale features
- Dashboard customization and advanced analytics trail leaders
How we chose
We started with vendor pricing pages and product documentation, checked in October 2026, because plan limits and trial terms are only accurate at the source. Every price and trial length above was read from the vendor's own site; where vendors do not publish pricing, we say so instead of citing a review site's figure. We then weighed feature coverage, deployment models and public reviews from IT practitioners, favoring tools that serve the two distinct buyers in this category: cloud-native teams who want observability, and traditional IT shops who want infrastructure monitoring. Open-source options were judged on total cost including the engineering time they demand.
How to pick the right monitoring approach
Start with where your systems live. Cloud-native teams running on AWS, Azure or GCP should shortlist Datadog, New Relic and Dynatrace: they are built for ephemeral infrastructure, containers and microservices. Traditional IT shops with on-premise servers, Windows domains and network hardware should shortlist PRTG, OpManager, Nagios XI and SolarWinds: they speak SNMP and WMI natively. Zabbix and LogicMonitor straddle both worlds.
Next, decide who does the work. SaaS tools (Datadog, New Relic, Site24x7, LogicMonitor) remove the operational burden of running the monitoring system itself. Self-hosted tools (Zabbix, Nagios, PRTG, OpManager) keep data in your network but make you the operator. That choice matters more than any feature comparison: a SaaS tool your team actually uses beats a powerful self-hosted tool nobody maintains.
Finally, model the bill honestly. Per-host pricing punishes sprawl, per-GB pricing punishes verbose logging, per-sensor pricing punishes metric-heavy devices, and per-user pricing punishes big teams. Take your current inventory, double it for growth, and run it through each vendor's pricing page before the trial ends. The cheapest quote today is rarely the cheapest bill in year two.
The first hidden cost is data ingest. New Relic's free 100 GB per month sounds generous until unstructured logs eat it in a week. Datadog's per-GB log pricing has the same dynamic. Before committing, measure your actual daily ingest and set up filtering and sampling rules on day one, not after the first invoice.
The second hidden cost is implementation services. Enterprise tools like Dynatrace, SolarWinds and Lucidworks-class platforms often need professional services to reach value, and those engagements can match the first year's license. Ask for services estimates in writing during evaluation, not after signing.
The third hidden cost is alert fatigue engineering. Every tool on this list can generate alerts; making those alerts useful requires tuning thresholds, building runbooks and integrating with PagerDuty or Opsgenie. Budget a few weeks of someone's time for this regardless of vendor. A monitoring tool with untrusted alerts gets ignored, and an ignored monitoring tool is just an invoice.
Frequently asked questions
What is system monitoring software?
System monitoring software continuously tracks the health and performance of your IT infrastructure: servers, networks, applications, databases and websites. It collects metrics like CPU, memory, disk and response times, alerts you when something crosses a threshold, and provides dashboards and historical data for troubleshooting. Modern platforms add log management, distributed tracing and AI-driven anomaly detection.
How much does system monitoring software cost?
It ranges from free (Zabbix, Nagios Core) to $9 per month (Site24x7) for small setups, $200 per month (PRTG) for mid-size networks, and $15 per host per month (Datadog) upward for cloud observability, with enterprise platforms like Dynatrace and SolarWinds quoted custom. The pricing unit matters more than the headline: per-host, per-GB, per-sensor and per-user models behave very differently as you grow.
What is the best pc system monitoring software for a small business?
For most small businesses, Site24x7 at $9 per month is the value pick: it covers website uptime, servers, networks and applications with a 30-day trial. If your infrastructure is Windows-heavy and on-premise, PRTG's freeware edition (100 sensors) or ManageEngine OpManager are strong alternatives. Teams with engineering capacity should consider Zabbix, which is free but demands setup time.
Should we choose open-source or commercial monitoring?
Choose open source (Zabbix, Nagios Core, Prometheus) when you have engineering time and want zero license cost with full control. Choose commercial when you want support contracts, faster setup and someone to call at 2 AM. Many organizations mix both: open source for internal systems, SaaS for customer-facing services. Be honest about the maintenance burden before calling open source free.
How do we avoid surprise bills from monitoring tools?
Measure your actual usage during the trial: daily log ingest in GB, host and container counts, custom metric cardinality and user seats. Then model the bill at twice your current scale using the vendor's pricing page. Set up ingest filtering, log sampling and retention policies before going live, and assign one person to review the monitoring bill monthly, just like cloud spend.
Sources we checked (10)
- https://www.datadoghq.com/pricing/
- https://newrelic.com/pricing
- https://www.dynatrace.com/
- https://www.paessler.com/pricing
- https://www.zabbix.com/
- https://www.nagios.com/products/nagios-xi/pricing/
- https://www.solarwinds.com/
- https://www.manageengine.com/network-monitoring/
- https://www.logicmonitor.com/
- https://www.site24x7.com/site24x7-pricing.html
Is your product missing or out of date?
We review this list regularly. Vendors can request a listing, send updated pricing or ask about featured placement.

Shihab Mia · Founder, Rankite
Shihab has spent more than a decade helping SaaS and e-commerce brands grow through search. He writes Rankite's software buying guides from pricing pages, documentation and public user reviews. More about Shihab.