How we make this list: we compare pricing pages, product documentation and public user reviews. Rankite is independent; if a vendor ever pays for a featured spot, that listing is clearly labeled Partner.
Quick comparison
| Tool | Best for | Starting price | Free plan |
|---|
 Paessler PRTG Paessler PRTG | SMBs that want one tool for network, servers, and storage | See website | Free trial |
 ManageEngine OpManager ManageEngine OpManager | IT teams that want storage monitoring inside a broader network management suite | See website | Free trial (30 days) |
 SolarWinds Storage Resource Monitor SolarWinds Storage Resource Monitor | enterprises with multi-vendor storage arrays (Dell EMC, NetApp, HPE, and more) | See website | Free trial |
 LogicMonitor LogicMonitor | enterprises that want SaaS monitoring with AI-driven incident handling | See website | Free trial |
 Datadog Datadog | cloud-native teams that need infrastructure, APM, and logs in one platform | See website | See website |
 Zabbix Zabbix | teams with the skills to run enterprise monitoring for free | Free (open source) | Yes (free open source) |
 Nagios XI Nagios XI | teams that want perpetual licenses and a massive plugin ecosystem | See website | Yes (free license, up to 7 nodes) |
 Checkmk Checkmk | organizations that need scalable monitoring with a genuine free tier | See website | Yes (free Community edition) |
 Site24x7 Site24x7 | small and mid-size teams that want cloud monitoring on a budget | $9/month | Yes (free plan) |
Is your product missing or out of date?
We review this list regularly. Vendors can request a listing, send updated pricing or ask about featured placement.
Key takeaways
- Zabbix is the only fully free, open-source option here with no device limits, but it demands real Linux and database skills to run well.
- Paessler PRTG and Site24x7 are the friendliest starting points for small teams: PRTG auto-discovers devices in hours, and Site24x7 starts at $9 a month with a free tier.
- SolarWinds Storage Resource Monitor is the most storage-specific tool on the list, built for multi-vendor array performance and capacity, but it is priced per disk and quote-based.
- Datadog and LogicMonitor are SaaS-first and AI-heavy, best for cloud-native or hybrid teams that want monitoring without managing servers.
- Count the licensing unit before you buy: per-sensor, per-device, per-node, and per-disk pricing models produce wildly different bills for the same environment.
The best storage monitoring software
#1
Paessler PRTG
Best for: SMBs that want one tool for network, servers, and storage
Visit paessler.com
Starting priceSee website
Free planFree trial
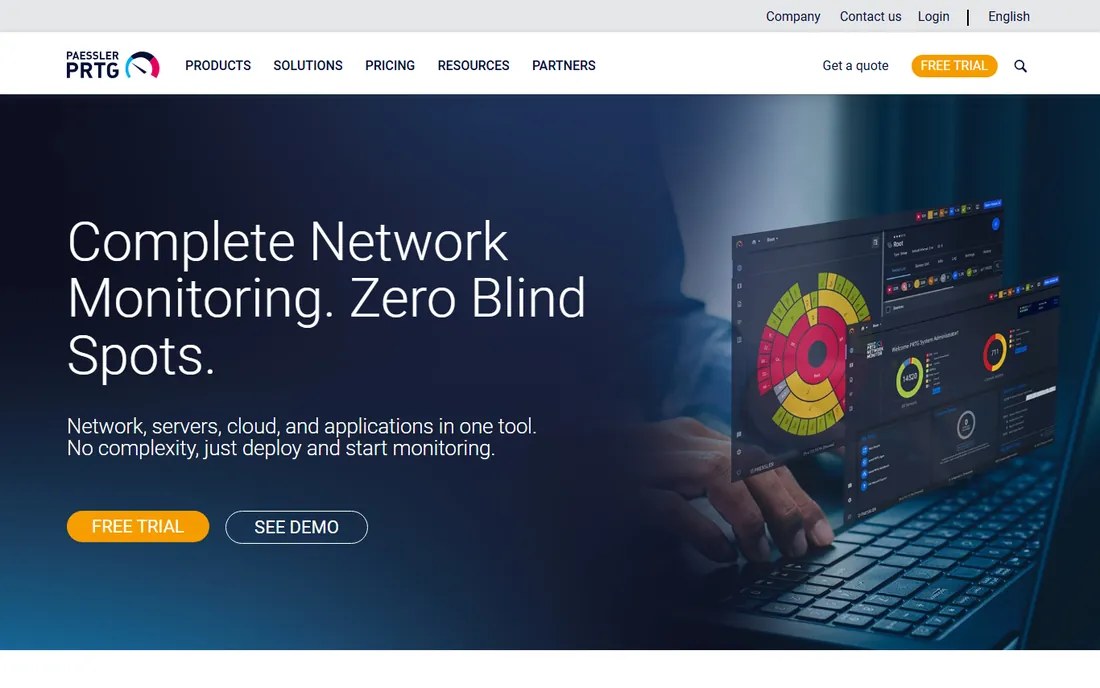
PRTG, short for Paessler Router Traffic Grapher, has been monitoring infrastructure since 2003 and now counts over 100,000 customers worldwide. The model is simple: everything is a sensor, and each sensor monitors one aspect of one device, from disk space and SMART health to bandwidth and application status. Auto-discovery scans your network, finds devices, and starts monitoring with preconfigured sensors, which is why small IT teams love it for getting visibility fast.
For storage specifically, PRTG tracks disk usage, array health, and NAS/SAN availability alongside everything else in the stack, so a storage alert arrives in the same console as the network and server alerts it correlates with. The trade-off is the sensor math: costs rise with every device and metric you add, and large environments can outgrow the model. The free trial lets you test with your real device count before committing.
What we like- Auto-discovery sets up monitoring in hours
- 200+ prebuilt sensor types
- Covers network, servers, cloud, and storage in one dashboard
Watch out for- Sensor-based pricing gets expensive as you scale
- On-premises focus with a hosted option added later
- Interface feels dated next to SaaS rivals
#2
ManageEngine OpManager
Best for: IT teams that want storage monitoring inside a broader network management suite
Visit manageengine.com
Starting priceSee website
Free planFree trial (30 days)

OpManager is ManageEngine's integrated network management platform, part of the Zoho Corp family. It monitors storage arrays, servers, virtual machines, and network devices together, with automated workflows, configurable discovery rules, and intelligent alerting built in. Storage monitoring here is one facet of a wider IT operations picture rather than a standalone specialty.
That breadth is the selling point for mid-size IT departments: instead of separate tools for network, storage, and servers, one console correlates alerts across all three, and the ManageEngine ecosystem adds service desk, endpoint, and log management when you need them. ManageEngine offers free 30-day trials with access to all premium features, so you can evaluate the full platform. Pricing is quote-based, and the per-device model means you should count your estate before asking for a number.
What we like- Storage, server, VM, and network monitoring in one console
- Automated workflows and intelligent alerting
- Free 30-day trial with all premium features
Watch out for- Interface carries the weight of a huge product suite
- Some advanced features need add-on modules
- Documentation can be hard to navigate
#3
SolarWinds Storage Resource Monitor
Best for: enterprises with multi-vendor storage arrays (Dell EMC, NetApp, HPE, and more)
Visit solarwinds.com
Starting priceSee website
Free planFree trial
Storage Resource Monitor (SRM) is the most storage-specific product on this list. It monitors performance and capacity across storage arrays from multiple vendors, giving real-time and historical visibility into every layer of the storage infrastructure: arrays, pools, LUNs, NAS volumes, and file shares. Prebuilt alerts warn before performance and capacity issues become outages, and the 40-plus vendor-agnostic widgets let you build dashboards and NOC displays around storage health.
SRM also integrates with other SolarWinds Platform modules like Server and Application Monitor for end-to-end mapping from application and virtualization down to the physical storage. The catch is licensing by disk count, which means a large estate gets expensive fast, and pricing is quote-only. If your problem is specifically "too many arrays from too many vendors," SRM is the specialist; if you need general infrastructure monitoring, the broader tools below may fit better.
What we like- Purpose-built for storage performance and capacity
- Supports arrays from many vendors in one view
- 40+ real-time and historical dashboard widgets
Watch out for- Licensed per disk, which gets costly for large arrays
- Needs the SolarWinds Platform to shine
- Quote-based pricing with no public numbers
#4
LogicMonitor
Best for: enterprises that want SaaS monitoring with AI-driven incident handling
Visit logicmonitor.com
Starting priceSee website
Free planFree trial
LogicMonitor is a SaaS observability platform that tracks more than two trillion metrics a day across five million devices, per the vendor. Its own guidance for storage monitoring calls out the metrics that matter: service time (latency), IO/s, and MB/s, alongside CPU, memory, and disk utilization for the hosts attached to the storage. Agentless auto-discovery finds devices and starts monitoring without deploying agents everywhere.
The differentiator in 2026 is Edwin AI, the company's agentic AI for IT operations, which correlates thousands of alerts into high-fidelity incidents, identifies root causes, and executes automated remediation workflows. LogicMonitor claims 67% ITSM incident reduction and 88% noise reduction from the AI layer. Pricing is per device and quote-based, with a 14-day trial commonly offered. It suits teams that want monitoring as a managed service rather than another server to babysit.
What we like- SaaS platform with agentless auto-discovery
- Edwin AI correlates alerts and guides remediation
- Covers storage metrics like latency, IOPS, and throughput
Watch out for- Per-device pricing adds up at scale
- No perpetual free tier
- Enterprise sales process
#5
Datadog
Best for: cloud-native teams that need infrastructure, APM, and logs in one platform
Visit datadoghq.com
Starting priceSee website
Free planSee website
Datadog is the observability giant: infrastructure monitoring, APM, log management, network monitoring, synthetic monitoring, and security in one SaaS platform, with AI agents (Bits AI) that chat, investigate, and remediate issues. For storage, it monitors the servers, VMs, containers, and cloud volumes your data lives on, with metrics, traces, and logs correlated in a single view.
The strength is correlation at cloud scale. When latency spikes on a cloud volume, Datadog shows the application traces, host metrics, and network data in one place, which is exactly what you need for root-cause analysis in distributed systems. The weakness for this category is that storage is one signal among many rather than the focus; you will build the storage dashboards yourself. Pricing is usage-based and notoriously complex, so run the calculator against your host and metric volume before signing.
What we like- Full-stack observability across infrastructure, APM, logs, and security
- Bits AI agents investigate and remediate
- Huge integration catalog
Watch out for- Pricing is complex and bills grow fast with usage
- Storage-specific views need dashboard work
- Overkill for small on-prem estates
#6
Zabbix
Best for: teams with the skills to run enterprise monitoring for free
Visit zabbix.com
Starting priceFree (open source)
Free planYes (free open source)
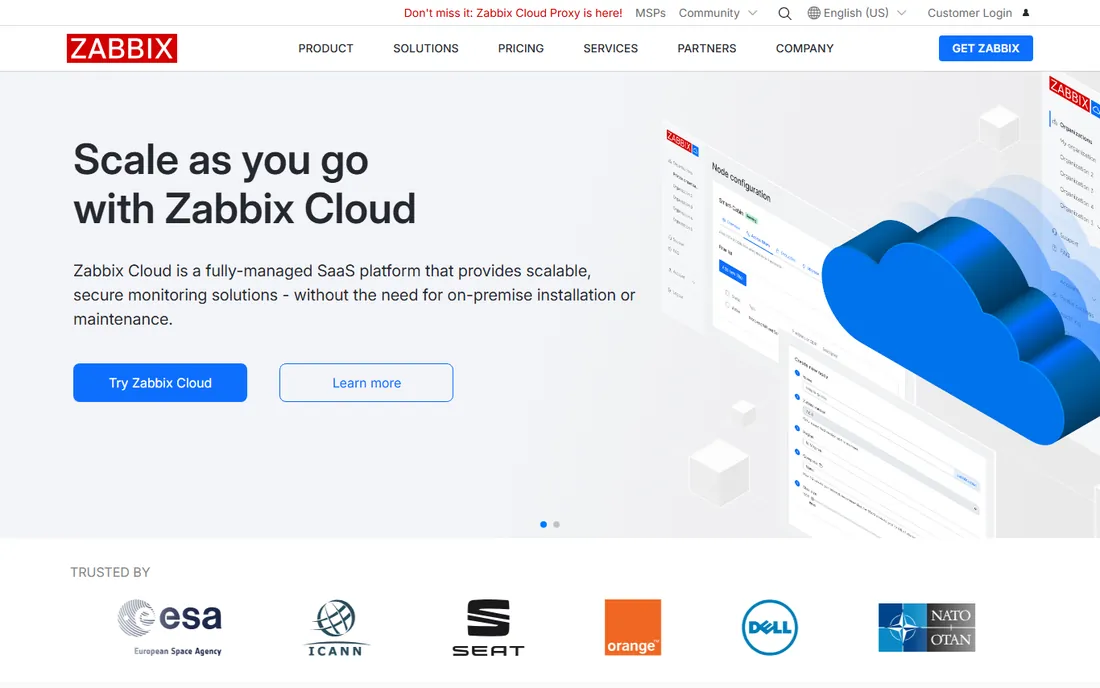
Zabbix is the open-source heavyweight: an enterprise-class distributed monitoring solution that is free to use with no limits on devices, hosts, or metrics. It collects data via SNMP, IPMI, JMX, and custom agents, stores it in a relational database, and provides alerting, visualization, and reporting through a web frontend. The vendor highlights customers from banks to the European Space Agency, which monitors the Columbus lab aboard the International Space Station with it.
For storage, Zabbix monitors disk usage, SMART attributes, array health via SNMP, and storage performance metrics, with templates for common hardware. The total cost of ownership is low because there are no license fees, only optional fixed-price support. The real cost is expertise: Zabbix needs a properly tuned database and someone who understands monitoring architecture. Teams that have those skills get enterprise monitoring for the price of their time.
What we like- Completely free with no device limits
- Enterprise-grade distributed monitoring
- Trusted by Fortune 500 companies and used by the European Space Agency
Watch out for- Demands Linux, database, and monitoring expertise
- Configuration has a steep learning curve
- Paid support is separate from the software
#7
Nagios XI
Best for: teams that want perpetual licenses and a massive plugin ecosystem
Visit nagios.com
Starting priceSee website
Free planYes (free license, up to 7 nodes)
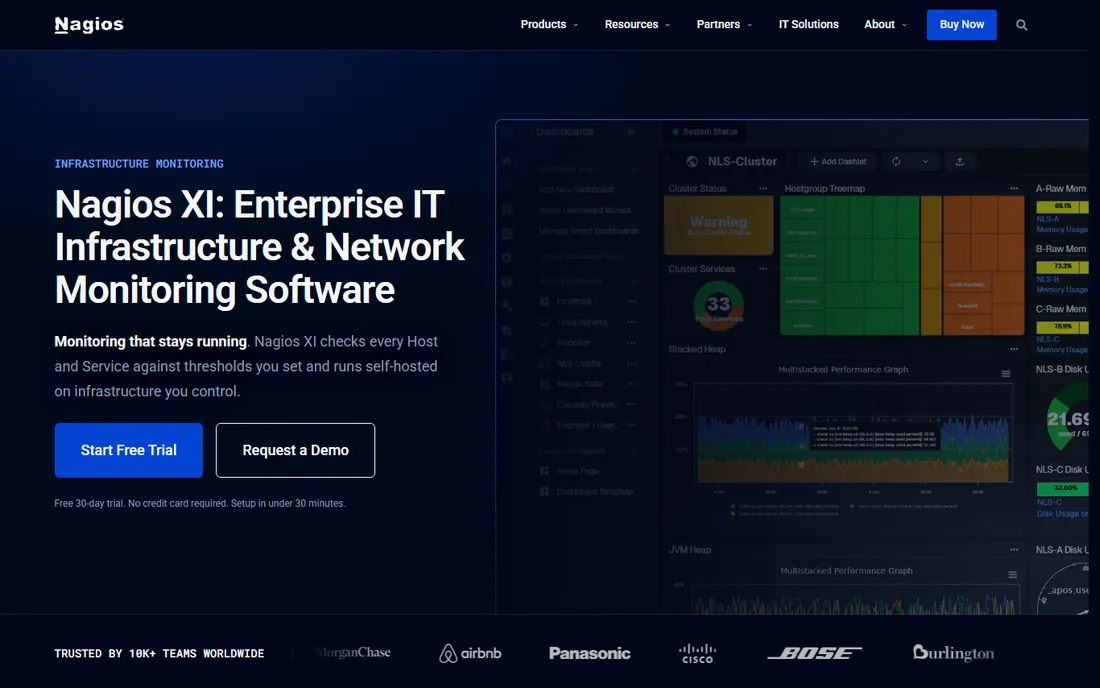
Nagios XI is the commercial front end for the Nagios Core monitoring engine, the granddaddy of open-source monitoring. It runs on a Linux server you own, executes checks against servers, network devices, applications, and services on your schedule, and notifies your team when thresholds break. Licensing is perpetual and priced by node (unique IP or hostname), with no limit on the number of services per node.
The ecosystem is the draw: thousands of community plugins on the Nagios Exchange cover everything from storage arrays to environmental sensors, and a plugin can be any executable that returns an exit code. The free license monitors 7 nodes or 100 services, which covers a small shop entirely. Downsides are the dated user experience and the manual configuration culture; this is a tool for teams that like control, not for teams that want monitoring to configure itself.
What we like- Perpetual license, priced per node with unlimited services
- Thousands of community plugins
- Free license covers up to 7 nodes or 100 services
Watch out for- Interface and workflow show their age
- Configuration is heavier than modern SaaS tools
- Enterprise features need the add-on edition
#8
Checkmk
Best for: organizations that need scalable monitoring with a genuine free tier
Visit checkmk.com
Starting priceSee website
Free planYes (free Community edition)
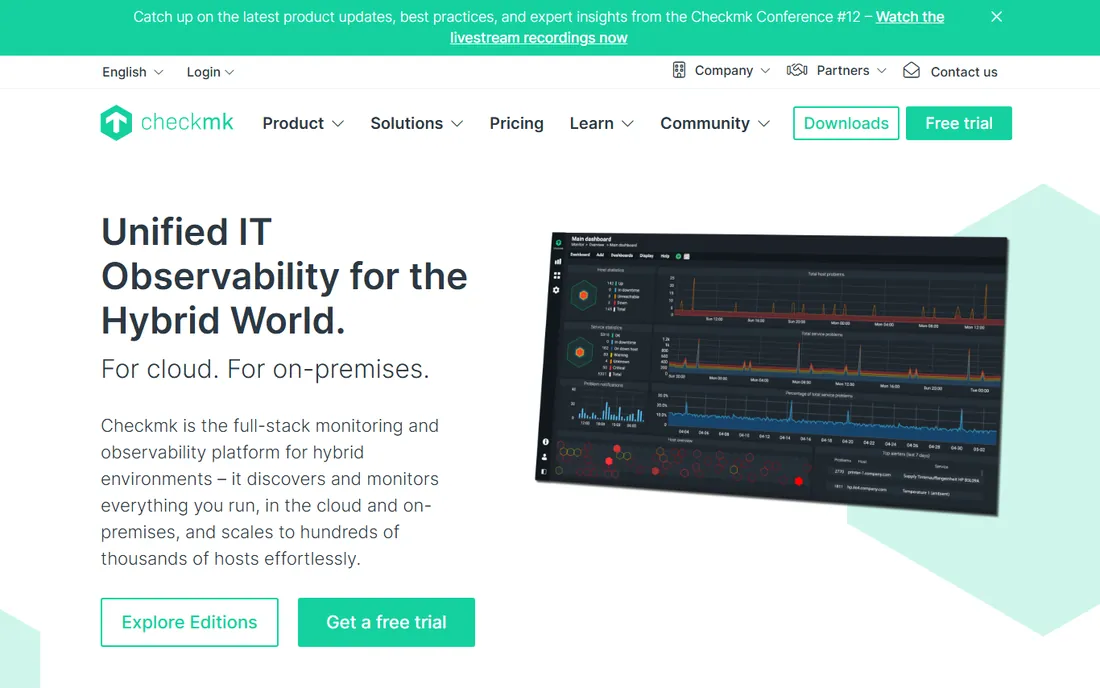
Checkmk started as an extension to Nagios and grew into a self-contained monitoring platform written in Python and C++. Its automated discovery finds hosts and services across servers, networks, storage, cloud workloads, containers, and applications, covering them through one of the largest integration catalogs in the market. The 2026 release added an MCP server that connects AI tools to live monitoring data, plus one-click AI root cause summaries.
The Community edition is free and open source under the GPL, with the full monitoring engine, web UI, and hundreds of plugins. Commercial Pro and Ultimate editions add distributed monitoring, automated agent management, and cloud-native features for Kubernetes and AWS/Azure/GCP. Checkmk handles hundreds of global sites from a single location, which makes it a strong pick for organizations that outgrow simpler tools but do not want SaaS pricing.
What we like- Free Community edition is fully functional
- Excellent scalability across hundreds of sites
- Huge integration catalog with automated discovery
Watch out for- Server component runs on Linux only
- Commercial editions need quotes
- Advanced automation features are paid
#9
Site24x7
Best for: small and mid-size teams that want cloud monitoring on a budget
Visit site24x7.com
Starting price$9/month
Free planYes (free plan)
Site24x7, part of the ManageEngine/Zoho family, is the value pick: an all-in-one observability platform covering website monitoring, server monitoring, cloud, APM, network, logs, and AIOps, trusted by 13,000-plus customers. The Starter tier begins at $9 a month, and there is a free-forever plan, which makes it the cheapest way to get serious monitoring on this list.
The platform includes AI-powered anomaly detection through Zia, which correlates spikes across network, cloud, and server data automatically, plus status pages, on-call schedules, and MSP multi-tenant mode. For storage, it monitors servers and NAS devices, disk health, and capacity trends alongside everything else. It will not replace a specialist like SolarWinds SRM for array-level depth, but for a team that needs monitoring across the whole stack without an enterprise budget, the price-to-coverage ratio is hard to argue with.
What we like- Starts at $9 a month with a free tier
- All-in-one website, server, cloud, and network monitoring
- AI-powered anomaly detection (Zia)
Watch out for- 10-second check frequency needs enterprise plans
- Breadth can overwhelm teams that only need basics
- Per-monitor pricing needs planning
How we chose
We looked for tools that monitor storage health, capacity, and performance as a core or strong secondary capability: disk and array monitoring, capacity planning, latency and IOPS metrics, and proactive alerting. For each candidate we read the vendor's own product pages and documentation, checked pricing pages where public, and read recent reviews on G2, Capterra, and Trustpilot for signals on reliability and support quality. We included both storage specialists (SolarWinds SRM) and general infrastructure platforms with strong storage coverage (PRTG, Zabbix, Datadog), plus free and open-source options, so the list works for a one-person IT shop and a global enterprise alike. Prices are as published in October 2026; where vendors keep pricing behind sales calls, we say so.
What to check before you buy
Start by counting what you will monitor, because licensing units decide the real price. PRTG charges per sensor, LogicMonitor and Checkmk per device, Nagios XI per node, and SolarWinds SRM per disk. The same 50-server estate can cost hundreds or thousands a month depending on the unit, so inventory your devices, arrays, and the metrics you need before requesting quotes.
Next, match the tool to your storage architecture. If you run multi-vendor arrays from Dell EMC, NetApp, and HPE, a specialist like SolarWinds SRM earns its keep. If your storage is cloud volumes attached to VMs, Datadog or LogicMonitor correlate better. If it is a rack of servers with local disks, PRTG, Zabbix, or Nagios XI cover it at a fraction of the cost.
Then test alerting on your real failure modes: a filling disk, a degraded RAID member, a latency spike. Set up the trial, simulate the failure, and see whether the alert arrives in time and with enough context to act. Finally, check the total cost of ownership honestly. Free software still costs engineer hours; SaaS still costs per-device fees that grow with you. The cheapest tool is the one that catches the 2 a.m. disk failure before it becomes a 9 a.m. outage, at a price your budget can carry.
Frequently asked questions
What is storage monitoring software?
Software that tracks the health, capacity, and performance of your storage: disk usage, array performance, IOPS, latency, SMART health, and hardware status. It alerts you before disks fill up or arrays fail, and it forecasts when you will need more capacity.
Do I need a storage-specific tool or a general monitoring platform?
It depends on your estate. If you manage arrays from several vendors, a storage specialist like SolarWinds SRM gives you array-level depth that general tools lack. If your storage is mostly server disks and cloud volumes, a general platform like PRTG, Zabbix, or Datadog covers it alongside everything else.
What is the difference between per-sensor, per-device, and per-disk pricing?
Per-sensor pricing (PRTG) charges for every metric on every device; per-device or per-node pricing (LogicMonitor, Nagios XI) charges once per monitored host regardless of checks; per-disk pricing (SolarWinds SRM) charges for each disk in your arrays. Count your estate in each vendor's unit before comparing headline prices.
Can I monitor storage for free?
Yes. Zabbix is fully free and open source with no device limits, Nagios XI has a free license for up to 7 nodes, Checkmk has a free Community edition, and Site24x7 offers a free plan. The trade-off is usually your time: free tools need more setup and expertise than paid SaaS options.
Which metrics matter most in storage monitoring?
Disk capacity and growth rate (to predict when you run out), IOPS and throughput (to spot performance bottlenecks), latency or service time (the metric users feel), SMART health and hardware status (to catch failing drives early), and array-level alerts from your vendor's management interface.
Sources we checked (15)
- https://www.paessler.com/
- https://manageengine.com/
- https://solarwinds.com/
- https://www.logicmonitor.com/
- https://www.datadoghq.com/
- https://www.zabbix.com
- https://www.nagios.com/products/nagios-xi/
- https://checkmk.com/
- https://www.site24x7.com/
- https://en.wikipedia.org/wiki/Paessler_PRTG
- https://en.wikipedia.org/wiki/Zabbix
- https://en.wikipedia.org/wiki/Checkmk
- https://www.thesmbguide.com/paessler-prtg
- https://github.com/ishandutta2007/awesome-cloud-monitoring-observability
- http://site24x7.com/blog/the-best-dns-monitoring-tools
Is your product missing or out of date?
We review this list regularly. Vendors can request a listing, send updated pricing or ask about featured placement.

Shihab Mia · Founder, Rankite
Shihab has spent more than a decade helping SaaS and e-commerce brands grow through search. He writes Rankite's software buying guides from pricing pages, documentation and public user reviews. More about Shihab.