How we make this list: we compare pricing pages, product documentation and public user reviews. Rankite is independent; if a vendor ever pays for a featured spot, that listing is clearly labeled Partner.
Key takeaways
- JMP says 100 percent of the world's 10 largest pharmaceutical companies use its software, showing how central statistics are to medical research.
- R is free and open source, while IBM SPSS Statistics starts at $99 per user per month and most enterprise tools are quote-based.
- GraphPad Prism (750,000 scientists in 110 countries) and MedCalc specialize in the biomedical analyses researchers actually run, like dose-response and ROC curves.
- SAS dominates regulated clinical-trial environments where FDA submissions demand auditable workflows.
- Choose based on who does the analysis: point-and-click tools for bench scientists, code-driven tools for biostatisticians.
Quick comparison
| Tool | Best for | Starting price | Free plan |
|---|
 IBM SPSS Statistics IBM SPSS Statistics | Familiar point-and-click statistics | $99/user/month (base subscription) | No |
 SAS SAS | Regulated clinical trials and pharma | See website | No |
 Stata Stata | Reproducible research and publication | See website | No |
 R R | Free open source statistical computing | Free | Yes |
 GraphPad Prism GraphPad Prism | Biostatistics for bench scientists | See website | Free trial |
 Minitab Minitab | Accessible statistical analysis | See website | No |
 JMP JMP | Interactive discovery for scientists | See website | Free trial |
 MedCalc MedCalc | Biomedical stats and ROC analysis | See website | Free trial |
Is your product missing or out of date?
We review this list regularly. Vendors can request a listing, send updated pricing or ask about featured placement.
The best statistical software for medical research
JMP says 100 percent of the world's 10 largest pharmaceutical companies use its software. That one line captures how much modern medicine depends on statistics: clinical trials, diagnostics, epidemiology, and drug development all run on statistical software.
The field splits by user. Bench scientists and clinicians usually want point-and-click tools with the right tests built in: GraphPad Prism, MedCalc, SPSS. Biostatisticians and programmers reach for code-driven environments: R, SAS, Stata. JMP and Minitab sit between the two with visual, interactive workflows. In regulated work like clinical trials, auditability matters as much as features.
Here are eight tools worth comparing.
#1
IBM SPSS Statistics
Best for: Familiar point-and-click statistics
Visit ibm.com
Starting price$99/user/month (base subscription)
Free planNo
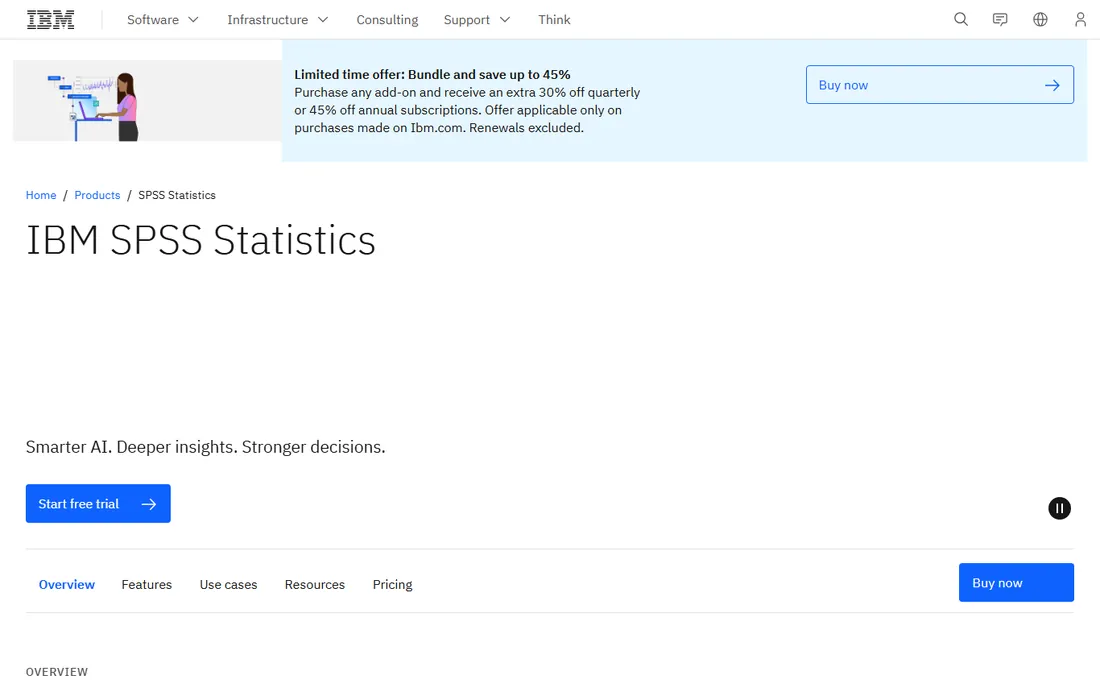
SPSS is the statistical package most researchers learned first. Its menu-driven interface lets you run regression, factor analysis, cluster analysis, and ANOVA without writing code, while syntax support keeps analyses reproducible. The base subscription starts at $99 per user per month, with add-on tiers for custom tables, advanced statistics, forecasting, decision trees, and complex sampling at $79 per user per month each.
Decades of use in universities and hospitals mean tutorials exist for everything, and reviewers trust familiar output. The downside is cost and pace: a fully equipped SPSS seat runs well above the base price, and the interface has changed less than its rivals. For departments that need a known, teachable quantity, it remains the default.
What we like- The most recognized name in academic statistics
- Menu-driven interface needs no coding
- Modular add-ons for advanced statistics, forecasting, and sampling
Watch out for- Quote-adjacent subscription tiers add up
- Feels dated next to modern tools
#2
SAS
Best for: Regulated clinical trials and pharma
Visit sas.com
Starting priceSee website
Free planNo
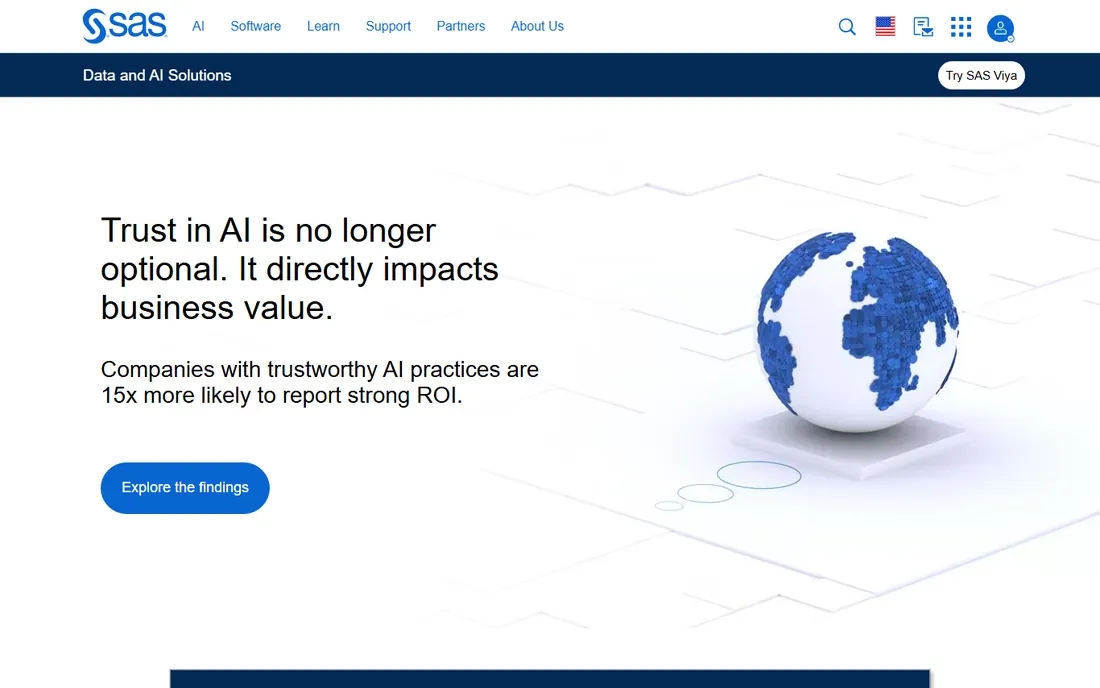
SAS has been the backbone of clinical research statistics since 1976. In pharmaceutical companies and contract research organizations, SAS programs produce the tables, listings, and figures that go into FDA submissions, with audit trails and validation that regulators accept. The modern SAS Viya platform adds visual analytics and machine learning on the same foundation.
Pricing is quote-based and enterprise-scale, which is the main reason smaller teams look elsewhere. The SAS language takes real study. But when the analysis must survive regulatory scrutiny, or when datasets are enormous, SAS is still the tool the industry trusts most.
What we like- The standard for FDA-submission-ready clinical data workflows
- Unmatched breadth from statistics to AI
- Deep pharma and healthcare adoption
Watch out for- Expensive, quote-based licensing
- Steep learning curve for the SAS language
Starting priceSee website
Free planNo
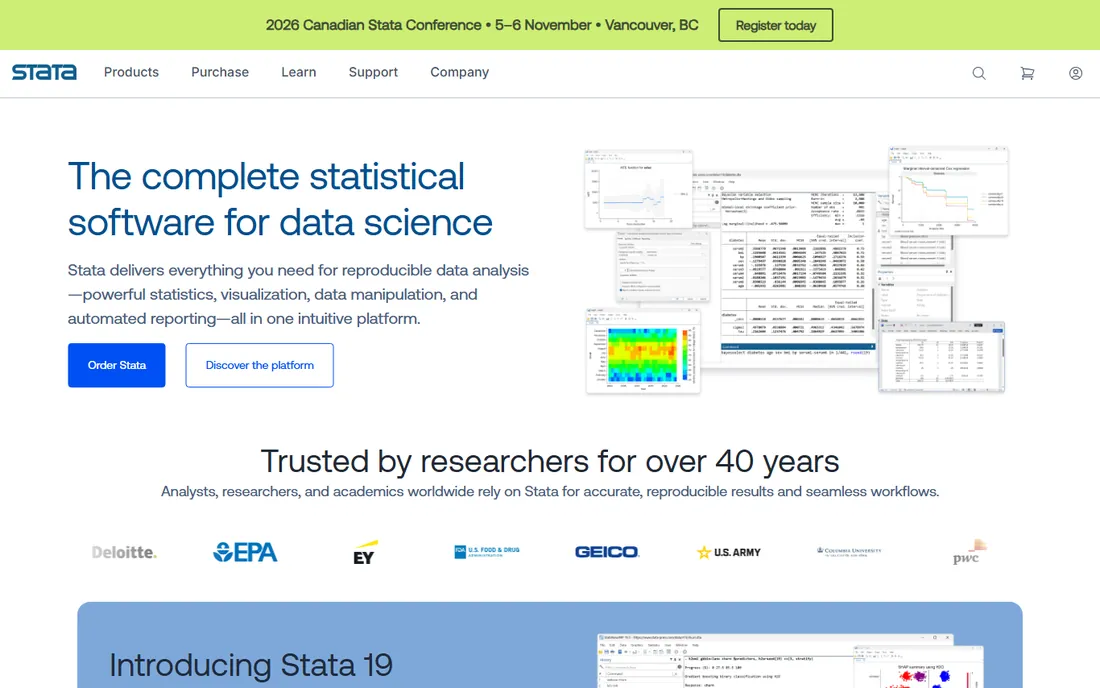
Stata's pitch is reproducibility taken seriously: code written decades ago still runs on modern Stata, with no need to keep old installations around. For medical research, where a published analysis should rerun identically years later, that matters. Its statistical features cover linear and logistic regression, survival models, causal inference, Bayesian analysis, and machine learning, with automated reporting to Word, Excel, PDF, and HTML.
Pricing is commercial and license-based, with academic discounts. It lacks R's free price and package ecosystem, but its consistency, documentation quality, and graphics make it a favorite in epidemiology and health economics. If reproducibility is a hard requirement, Stata is the safest commercial choice.
What we like- Fanatical about backward compatibility and reproducibility
- Publication-quality graphics
- Strong in econometrics, biostatistics, and epidemiology
Watch out for- Commercial licensing with no free tier
- Smaller user community than R
Starting priceFree
Free planYes
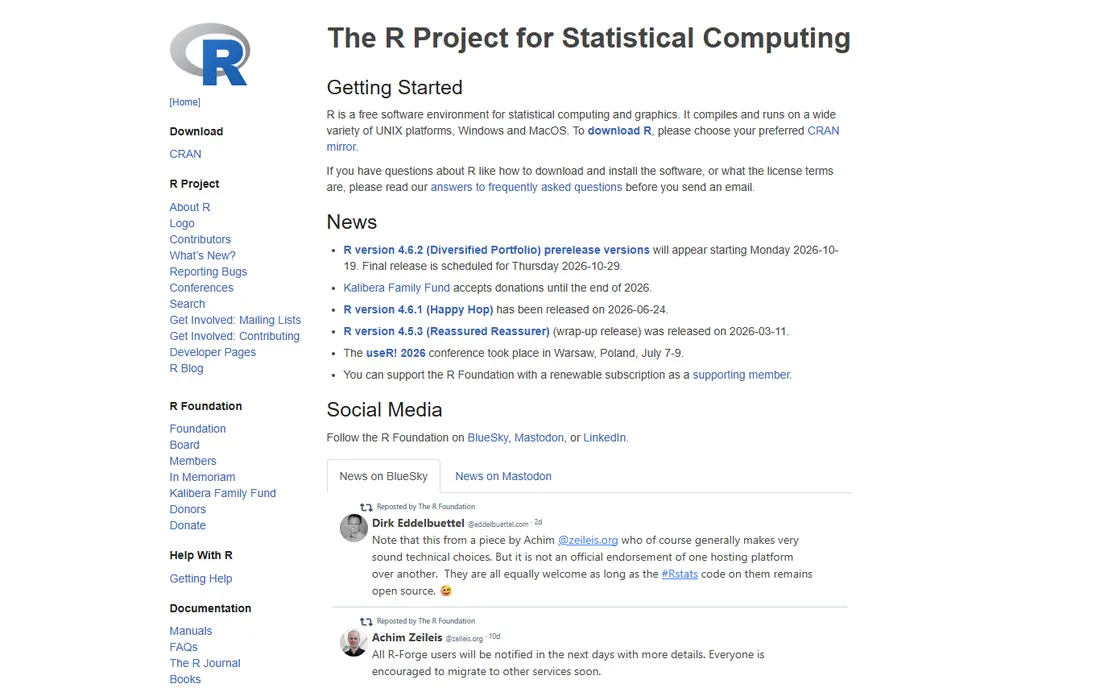
R is the free software environment behind much of modern biostatistics. Thousands of packages on CRAN and Bioconductor cover every method from standard regression to the newest genomics methods, spatial epidemiology, and clinical trial simulation. R Markdown and Quarto weave code, results, and narrative into reproducible reports that journals accept.
The cost is programming skill and vigilance: package quality varies, and dependency management needs discipline in regulated work. But nothing matches R's breadth at zero price, and its community is enormous. For research teams with statistical programming capacity, R plus Bioconductor is the most powerful free option in existence.
What we like- Completely free with the largest statistical method library on earth
- Bioconductor serves genomics
- R Markdown makes analyses reproducible
Watch out for- Programming required
- Package quality varies and versioning needs care
Starting priceSee website
Free planFree trial
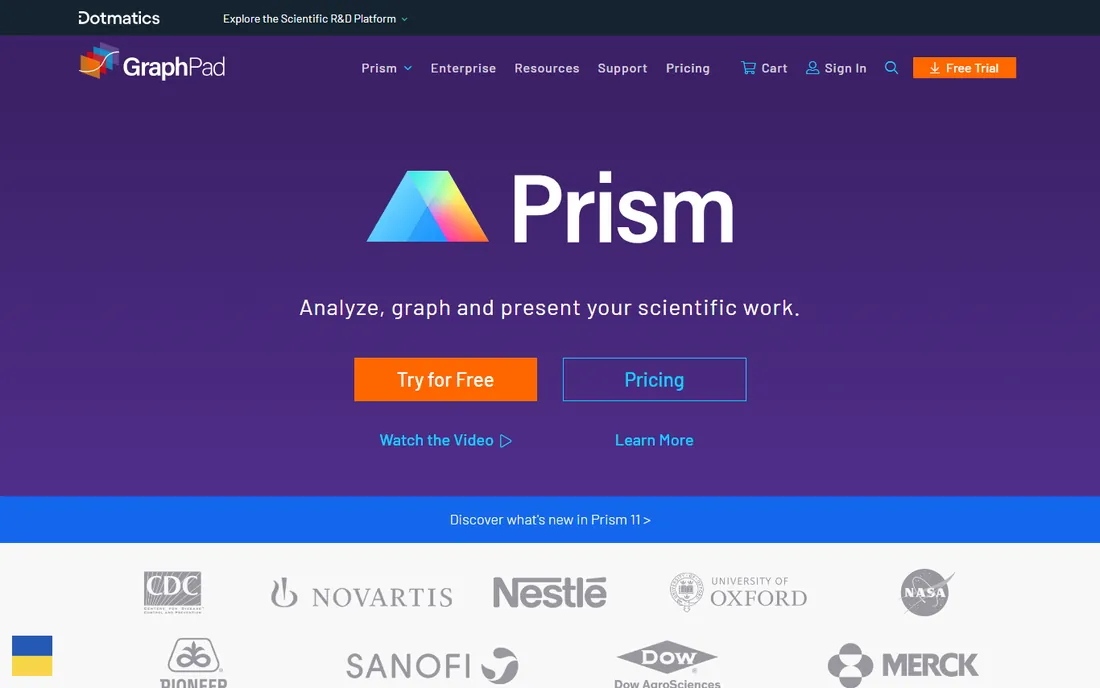
Prism is the statistics tool of the life sciences bench: more than 750,000 scientists in 110 countries use it, and its logos include the CDC, Novartis, Sanofi, and the University of Oxford. Data tables are structured for scientific research, and the software guides you to appropriate analyses for dose-response curves, survival analysis, and contingency tables, all with no coding.
Graphs are publication-quality and export to nearly any format, and Prism Cloud enables collaboration. A free trial requires no credit card. The trade-off is scope: for general-purpose statistics or big data, SPSS, R, or SAS go further. For bench scientists who need correct analyses and beautiful figures fast, Prism is purpose-built.
What we like- Built for scientists, not statisticians, with guided analyses
- 750,000-plus users in 110 countries
- Publication-quality graphs with no coding
Watch out for- Narrower scope than SPSS or R
- Commercial pricing after the trial
Starting priceSee website
Free planNo
Minitab has spent decades making statistics approachable: the interface guides users through analyses with plain-language output, which is why it is a staple in quality engineering and process improvement. Its statistical software runs in the cloud, and the broader portfolio adds improvement management and predictive analytics.
For medical research, Minitab's strengths are design of experiments, measurement analysis, and process statistics rather than clinical-specific methods. Pricing is not published on the site. It fits research-adjacent teams, quality departments in medical device companies, and organizations that value usability over specialized biomedical features.
What we like- Friendly interface that teaches as it goes
- Strong in quality and process statistics
- Cloud access available
Watch out for- Pricing not published
- Less specialized for clinical research than Prism or MedCalc
#7
JMP
Best for: Interactive discovery for scientists
Visit jmp.com
Starting priceSee website
Free planFree trial

JMP, from SAS, is statistical discovery software built around interactive visualization: drag, link, and drill into data to find answers, with the software scientists and engineers trust for the job. JMP Pro adds predictive analytics, and JMP Clinical is purpose-built for clinical trial safety and efficacy analysis. The company reports use by 100 percent of the world's 10 largest pharmaceutical, chemical, and semiconductor companies.
A free trial is available from the site. Pricing is quote-based. JMP suits scientists who think visually and want to explore data interactively rather than write code, while JMP Clinical gives clinical teams a dedicated platform for trial data.
What we like- Interactive, visual exploration finds patterns fast
- JMP Clinical serves trial safety and efficacy
- Used by 100% of top-10 pharma
Watch out for- Quote-based pricing
- Different workflow from traditional statistics packages
Starting priceSee website
Free planFree trial
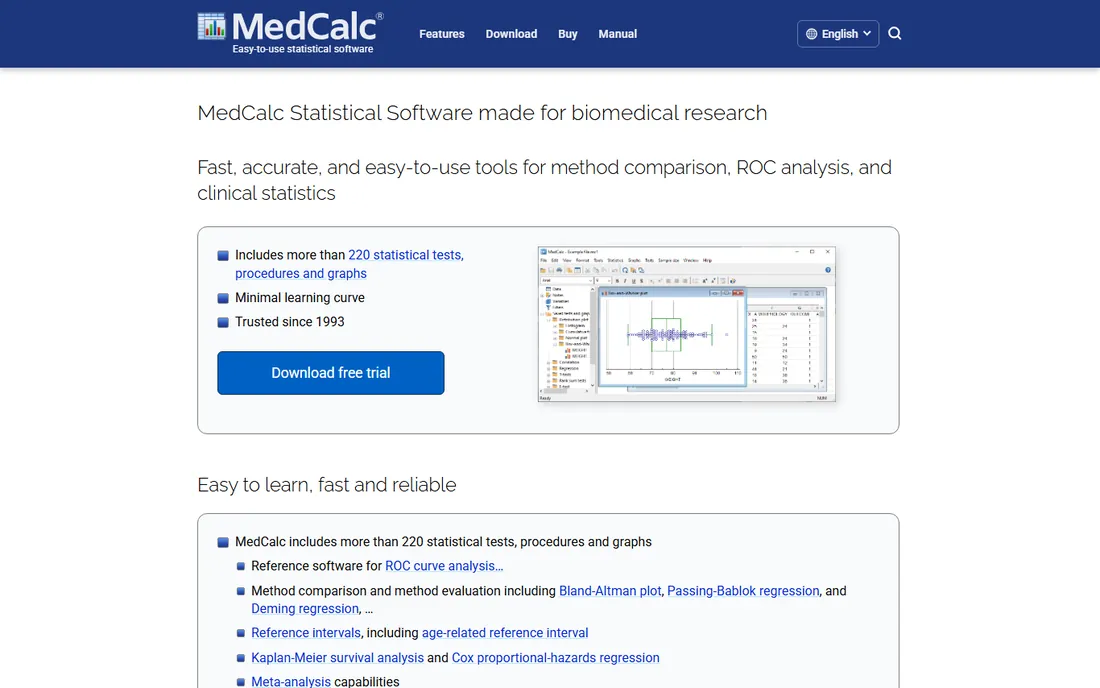
MedCalc is statistical software designed from the ground up for biomedical research: more than 220 statistical tests, procedures, and graphs, with particular strength in ROC curve analysis, method comparison (Bland-Altman, Passing-Bablok), and clinical quality control. Graphs export in high resolution for publication, and one edition includes every feature.
Licensing is simple: a perpetual single-user license with no monthly fees, a yearly subscription, or site and network licenses, all with free updates. A free trial is available. The limitation is Windows only. For clinical researchers who need the right biomedical tests without learning R, MedCalc is a focused, affordable choice.
What we like- Made specifically for biomedical research with 220-plus tests
- Industry-leading ROC curve analysis
- One edition with all features, no hidden extras
Watch out for- Windows only
- Smaller company behind it than the big vendors
How we chose
We compared statistical software using official vendor pages, documentation, and pricing pages, focusing on biomedical-specific features, regulatory suitability, reproducibility, ease of use for non-programmers, graphics quality, and pricing transparency. We checked adoption claims against vendor-published figures and consulted reviews on G2, Capterra, and research communities. We did not claim hands-on testing; assessments reflect documented features and reported user experience.
What to consider before choosing statistical medical research software
Match the tool to the analyst. If the people running analyses are bench scientists or clinicians, prioritize point-and-click tools with the right biomedical tests built in: GraphPad Prism, MedCalc, or SPSS. If they are biostatisticians, code-driven environments like R, SAS, or Stata give more power and better reproducibility. Buying R-level power for a team that needs Prism-level guidance wastes both money and morale.
Check regulatory requirements first
If your work feeds FDA submissions, grant-funded clinical trials, or published research with data-sharing mandates, the tool must support validated, auditable workflows. SAS and Stata have the strongest track records in regulated settings. R can work in regulated environments but needs careful version control and validation procedures.
Count the real cost, not the license
A $99-a-month SPSS seat or a free R installation can both be expensive in the wrong hands: training, analysis time, and errors cost more than licenses. Estimate who will use the tool, what they already know, and how much training the switch requires. Sometimes the cheapest tool is the one your team already knows.
Test with your actual data
Statistical tools behave differently with messy real-world data than with textbook examples. Run trials on your own datasets: import your files, run your standard analyses, and produce your usual figures. Pay attention to missing-data handling, which varies widely and matters enormously in clinical research.
Why reproducibility is now the deciding factor
Journals, funders, and regulators increasingly demand that published analyses can be rerun and verified. Tools that bake in reproducibility, like Stata's backward compatibility, R Markdown's code-plus-narrative documents, and SAS's validated workflows, have a growing edge over click-only tools with no audit trail. Whatever you choose, insist on a workflow where every number in a paper can be traced back to the code or clicks that produced it.
Frequently asked questions
What statistical software do medical researchers use most?
GraphPad Prism dominates bench-level biostatistics, SAS dominates clinical trials and pharma, R dominates academic biostatistics and genomics, and SPSS remains common in medical schools and hospitals. Stata is strong in epidemiology and health economics. The right choice depends on the user's skills and the work's regulatory context.
Is SPSS or R better for medical research?
SPSS is easier to learn and widely taught, making it good for teams without programming skills. R is free and far more powerful, with thousands of specialized packages, but requires programming. Many departments use both: SPSS for teaching and quick analyses, R for serious biostatistics.
Can I use R for FDA clinical trials?
Yes, R is increasingly used in clinical trials, but regulated work requires validated workflows, version control, and documentation that the tool produces correct results. Many pharma companies use R alongside SAS. Expect extra validation effort compared to SAS's established regulatory track record.
What is ROC analysis and which tool does it best?
ROC (receiver operating characteristic) analysis evaluates diagnostic test accuracy by plotting sensitivity against specificity. MedCalc is widely regarded as having the best ROC curve tools, with dedicated method-comparison features. GraphPad Prism and R also handle ROC analysis well.
Is there free statistical software for medical research?
Yes. R is completely free and the most capable option. JAMOVI and JASP are free, user-friendly alternatives built on R that suit teaching and basic research. Many commercial tools offer free trials but not permanent free tiers.
Which tool is best for clinical trial data?
SAS is the industry standard for clinical trial statistics and FDA submissions. JMP Clinical is purpose-built for trial safety and efficacy analysis. For smaller trials, Stata and R both handle the required methods, with Stata offering stronger commercial support.
Sources we checked (8)
- https://www.ibm.com/products/spss-statistics
- https://www.sas.com/
- https://www.stata.com/
- https://r-project.org/
- https://graphpad.com/
- https://www.minitab.com/
- https://www.jmp.com/
- https://medcalc.org/
Is your product missing or out of date?
We review this list regularly. Vendors can request a listing, send updated pricing or ask about featured placement.

Shihab Mia · Founder, Rankite
Shihab has spent more than a decade helping SaaS and e-commerce brands grow through search. He writes Rankite's software buying guides from pricing pages, documentation and public user reviews. More about Shihab.