How we make this list: we compare pricing pages, product documentation and public user reviews. Rankite is independent; if a vendor ever pays for a featured spot, that listing is clearly labeled Partner.
Key takeaways
- Geekbench 7, Cinebench 2026, Novabench, CPU-Z, and HWiNFO are all free for personal use.
- Geekbench is the best cross-platform benchmark covering Windows, Mac, Linux, Android, and iOS.
- Cinebench 2026 is the industry standard for CPU rendering performance, free from Maxon.
- 3DMark costs $34.99 and is the gamer's benchmark for CPU and GPU together.
- PassMark and AIDA64 serve professionals who need deep diagnostics and large comparison databases.
Quick comparison
| Tool | Best for | Starting price | Free plan |
|---|
 Geekbench Geekbench | cross-platform CPU and GPU benchmarking | Free | Yes |
 Cinebench Cinebench | CPU rendering performance | Free | Yes |
 3DMark 3DMark | gaming CPU and GPU performance | $34.99 | Free trial |
 Novabench Novabench | quick full-system benchmarking | Free | Yes |
 PassMark PerformanceTest PassMark PerformanceTest | deep CPU diagnostics and comparisons | See website | No |
 AIDA64 AIDA64 | system diagnostics and stress testing | See website | Free trial |
 CPU-Z CPU-Z | CPU identification and real-time monitoring | Free | Yes |
 HWiNFO HWiNFO | comprehensive hardware monitoring | Free | Yes |
Is your product missing or out of date?
We review this list regularly. Vendors can request a listing, send updated pricing or ask about featured placement.
The best CPU benchmark software
Starting priceFree
Free planYes
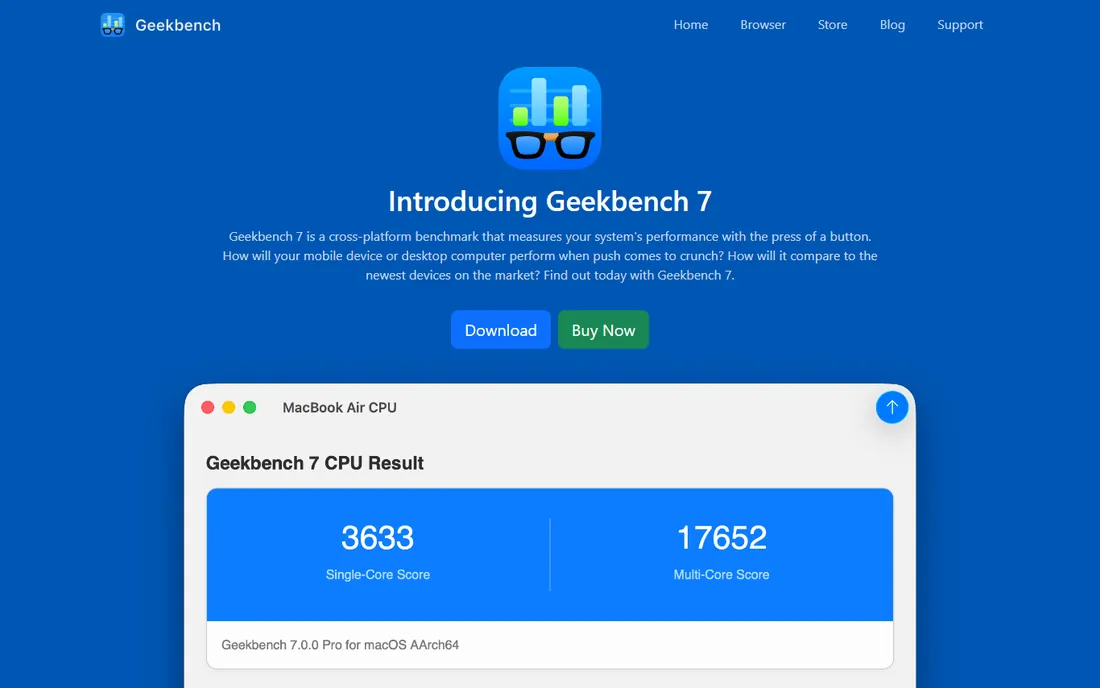
Geekbench 7 is the cross-platform benchmark that reviewers and enthusiasts quote, free for personal use across macOS, Windows, Linux, Android, and iOS. The scoring separates single-core and multi-core performance with workloads designed to simulate real-world tasks: file compression, PDF rendering, image processing, and machine learning. Geekbench 7 Pro costs $99 for commercial use with command-line tools.
The cross-platform coverage is unmatched: compare a phone, a laptop, and a desktop on the same scale. The large result database lets you check how your hardware stacks up against identical systems.
Free users must upload results online to run the benchmark, and synthetic scores never perfectly predict application performance. For quick, comparable CPU testing on any device, Geekbench is the standard.
What we like- Free for personal use
- Windows, Mac, Linux, Android, iOS
- Single and multi-core scores
Watch out for- Free version requires uploading results
- Synthetic scores do not match every workload
Starting priceFree
Free planYes

Cinebench 2026 from Maxon is the industry-standard CPU benchmark, free for everyone. It renders a complex 3D scene using Maxon's Cinema 4D engine, stressing every core to measure real rendering throughput. The 2026 version added GPU testing and a new engine, so scores are not comparable to older versions.
The rendering workload is brutally honest: it shows sustained multi-core performance under full load, which is exactly what creators and engineers need to know. The simplicity is a feature: download, run, get a score.
It measures rendering, not general computing, so office-work performance needs other tests. For anyone buying a CPU for 3D, video, or content work, Cinebench is the number that matters.
What we like- Free
- Industry-standard rendering test
- CPU and GPU testing
- Simple to run
Watch out for- Scores not comparable across versions
- Rendering-focused, not general computing
Starting price$34.99
Free planFree trial
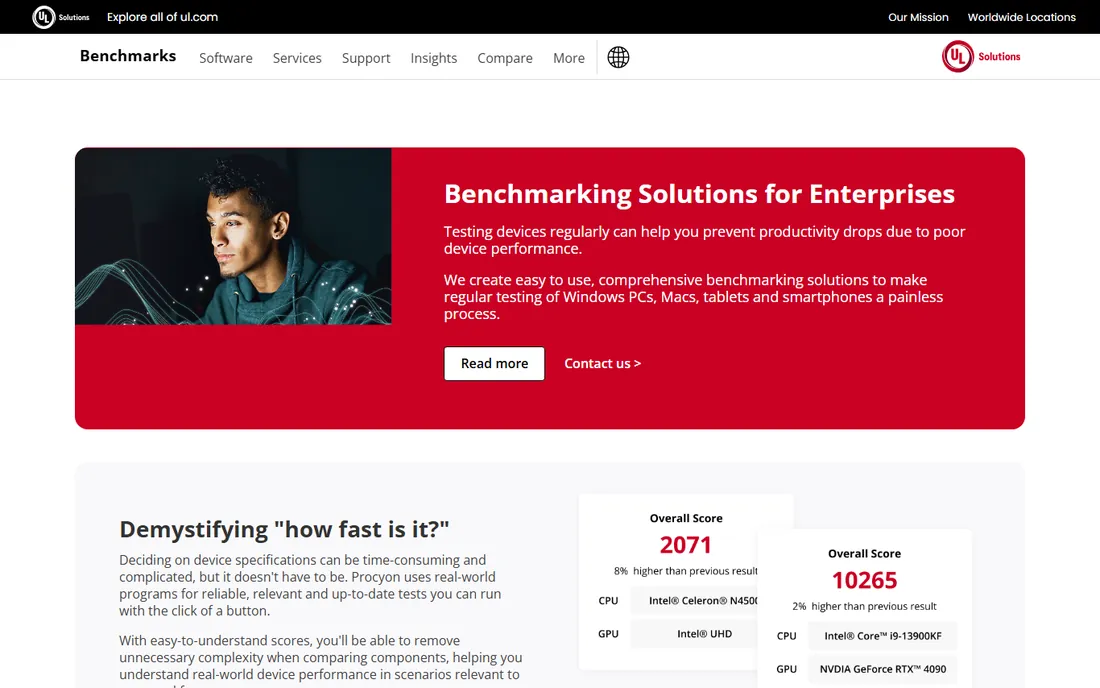
3DMark from UL is the gamer's benchmark, available for $34.99 on Steam with a free basic edition. The CPU Profile test measures scaling across thread counts from single-thread to max threads, showing exactly how a processor handles gaming workloads. The result database, updated daily from tens of thousands of submissions, makes comparisons easy.
For gaming PCs, the combination of CPU and GPU testing in one suite is the point: Time Spy and the CPU Profile together show whether the processor or the graphics card is the bottleneck. The benchmarks are visually impressive enough that running them is almost fun.
It is gaming-focused, so workstation and server buyers need other tools. For gamers comparing CPUs, 3DMark is the benchmark that counts.
What we like- $34.99 on Steam
- CPU Profile tests scaling
- Huge result database
- Industry standard for gaming
Watch out for- Gaming-focused
- Paid for full version
- Windows-centric
Starting priceFree
Free planYes
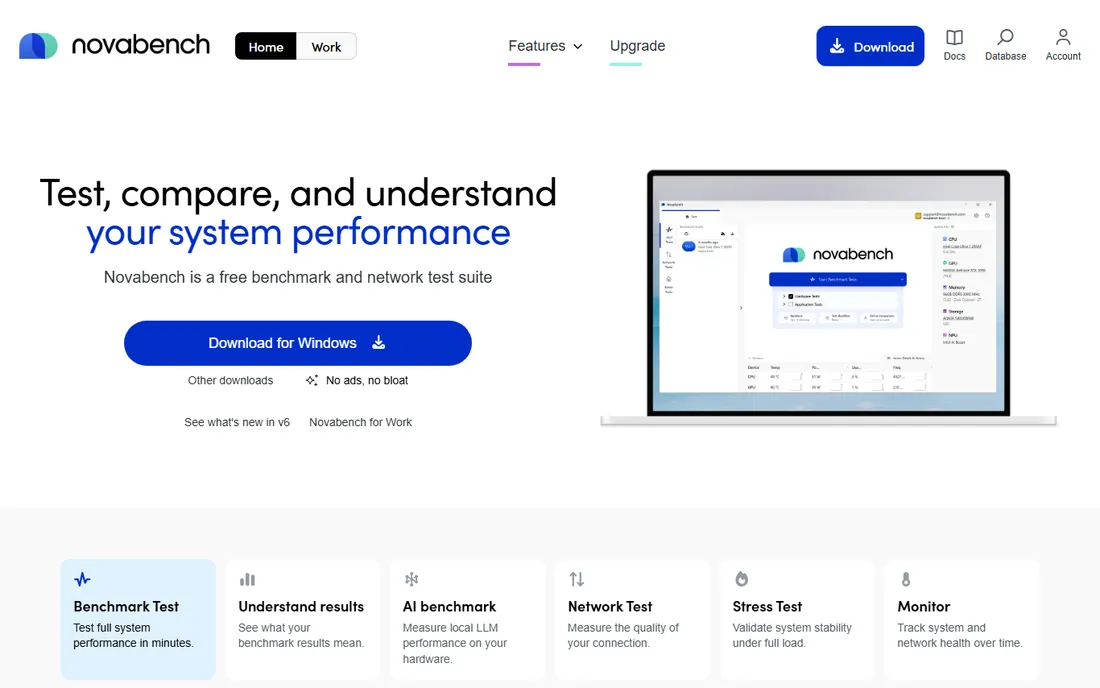
Novabench is the free all-in-one benchmark that tests your whole system in about a minute: CPU float, integer, and hash operations, GPU, RAM, and disk read and write speeds. The free version covers non-commercial use, with a Pro version adding portability and features.
The speed is the appeal: one run, one score, and a comparison page showing how your hardware stacks against similar systems. For quick health checks and upgrade decisions, nothing is faster.
The tests are simpler than the specialist benchmarks, and the comparison data is less detailed than Geekbench's or PassMark's. For a fast free overview of system performance, Novabench delivers.
What we like- Free for non-commercial use
- Tests CPU, GPU, RAM, and disk in one run
- Fast, about a minute
Watch out for- Simpler tests than specialists
- Comparison data less detailed
Starting priceSee website
Free planNo
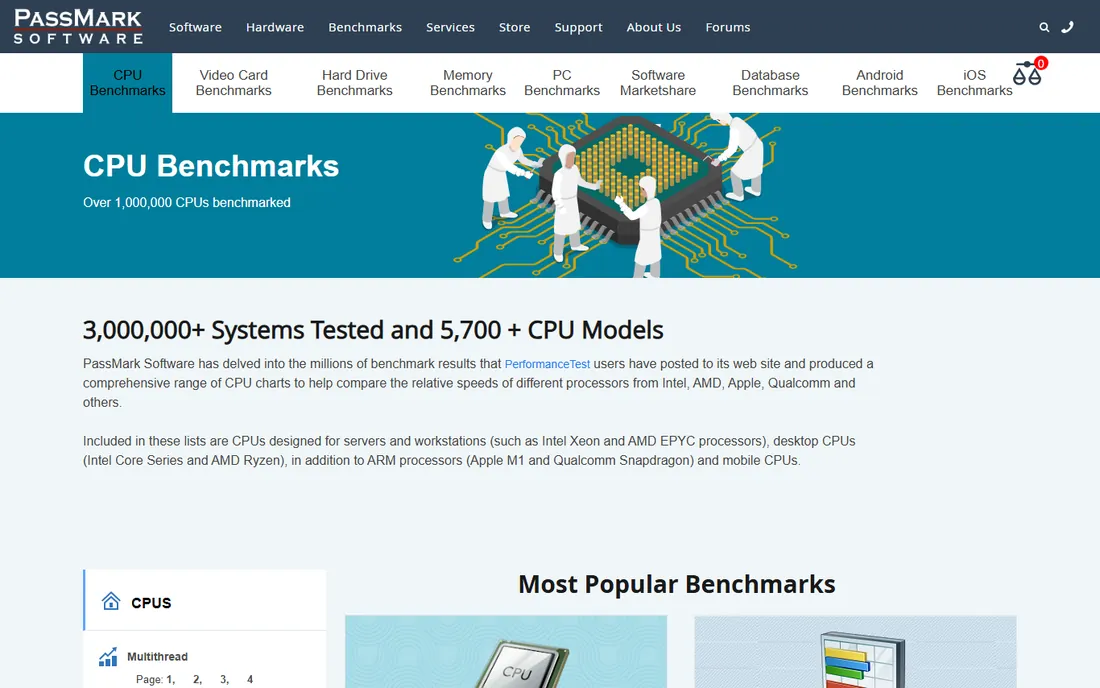
PassMark's PerformanceTest and its cpubenchmark.net database are the professional reference for CPU comparisons. The multi-threaded benchmarks produce the detailed scores that hardware reviewers and IT buyers rely on, with a database covering everything from old Pentiums to current server chips.
The comparison depth is the value: filter by single-thread, multi-thread, price, and power to find the right processor for any workload. IT departments use PassMark scores for fleet purchasing decisions.
The testing tool pricing is not published on the comparison site, and the software is Windows-focused. For serious CPU comparison shopping, the PassMark database is the reference.
What we like- Massive CPU comparison database
- Detailed multi-threaded benchmarks
- Trusted by professionals
Watch out for- Pricing not published here
- Windows-focused testing tool
Starting priceSee website
Free planFree trial
AIDA64 from FinalWire is the system profiler that enthusiasts and IT professionals use for deep diagnostics. Beyond CPU benchmarks, it offers stress testing, sensor monitoring with on-screen displays, and a hardware database that identifies components other tools miss. A free trial is available.
The stress testing serves overclockers and system builders: verify stability under full load with temperature and voltage monitoring. The auditing features suit IT departments inventorying fleets.
It is a diagnostic suite rather than a pure benchmark, and pricing requires checking the vendor site. For deep system analysis alongside benchmarking, AIDA64 is the professional choice.
What we like- Deep hardware diagnostics
- CPU stress testing
- Sensor monitoring
- Huge hardware database
Watch out for- Pricing not published here
- More diagnostic tool than pure benchmark
#7
CPU-Z
Best for: CPU identification and real-time monitoring
Visit cpuid.com
Starting priceFree
Free planYes
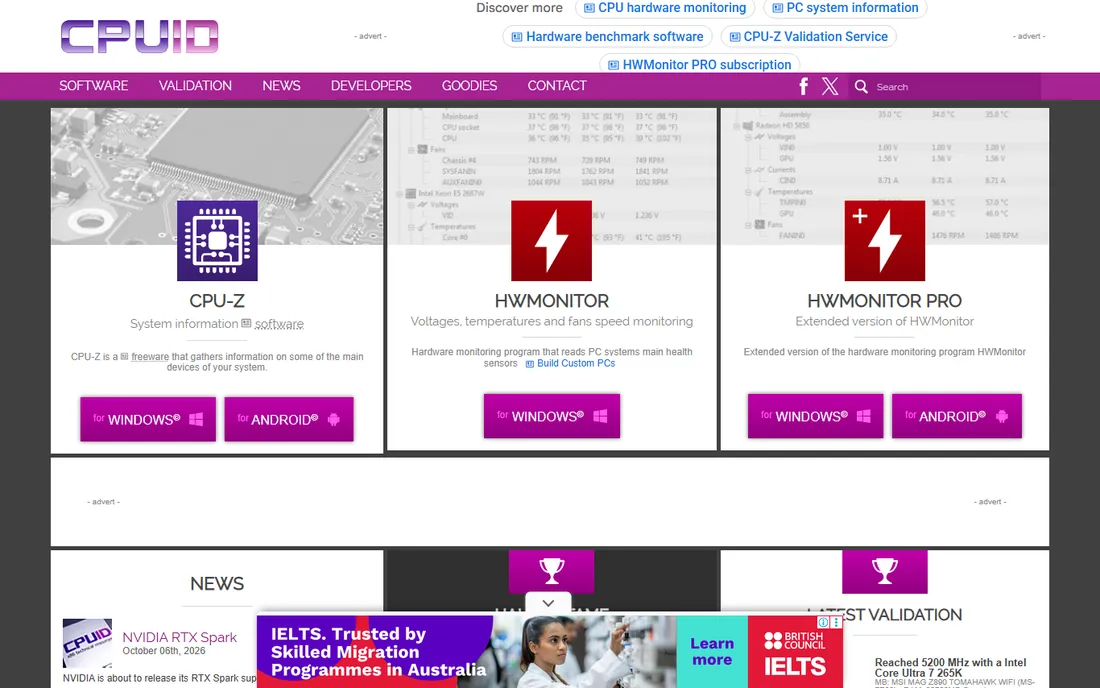
CPU-Z from CPUID is the free utility that tells you exactly what processor you have: name, codename, process, package, cache levels, clock speeds, and voltages in real time. The 4.6 MB download needs no installation in portable form, and it is fully supported on Windows 11 including ARM64.
Every hardware forum on the internet uses CPU-Z screenshots to verify specifications, which tells you everything about its trust level. The memory tab shows timings and SPD data that overclockers need.
It identifies and monitors rather than benchmarking, so pair it with a real benchmark for performance scores. For knowing exactly what is in your machine, CPU-Z is essential and free.
What we like- Free
- Tiny 4.6 MB download
- Detailed CPU, cache, and memory info
- Portable version
Watch out for- Information tool, not a benchmark
- Windows and Android only
Starting priceFree
Free planYes
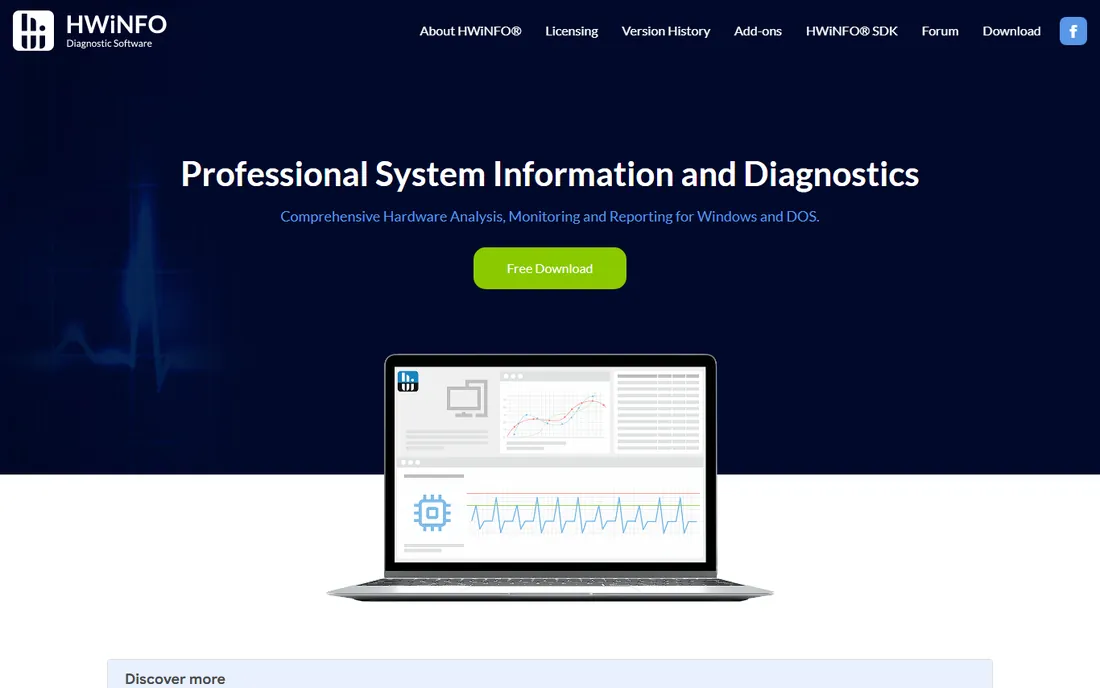
HWiNFO is the free hardware monitoring tool that shows everything: CPU temperatures per core, voltages, fan speeds, GPU data, and hundreds of sensors in real time. The reporting is exhaustive enough for professional diagnostics and overclocking validation.
The depth serves anyone who needs to know what their hardware is doing under load: thermal throttling detection, voltage stability, and cooling performance. Professionals trust it for system validation.
Beginners face information overload, and it monitors rather than benchmarks. For watching your CPU during a benchmark run, HWiNFO paired with Cinebench or 3DMark is the complete picture.
What we like- Free
- Exhaustive sensor monitoring
- Detailed reporting
- Trusted by professionals
Watch out for- Information overload for beginners
- Monitoring tool, not a benchmark
How we chose
We compared CPU benchmark software on test accuracy and relevance, platform coverage, result comparability, database size for comparisons, stress testing features, and pricing. We checked current vendor pages, 2026 hardware coverage, and enthusiast consensus. We did not run benchmark labs; assessments reflect current documentation and reviewer consensus as of October 2026.
A Geekbench score, a Cinebench score, and a 3DMark score measure different things and cannot be compared to each other. Worse, scores are not comparable across versions of the same tool: Cinebench 2026 scores mean nothing next to Cinebench R23 scores because the engine changed.
When comparing CPUs, use the same benchmark version for both chips. The vendor databases, Geekbench Browser, PassMark's charts, UL's best-processor pages, make this easy by aggregating identical-version results.
Also remember that benchmarks measure specific workloads. A chip that wins Cinebench may lose in gaming; a single-core champion may trail in rendering. Match the benchmark to your actual work: rendering tests for creators, gaming tests for gamers, single-core tests for office work.
Choosing the right benchmark for your question
"Is my CPU faster than the new one?" Use Geekbench or PassMark for broad comparison across architectures and generations. "Will it render faster?" Use Cinebench. "Will games run better?" Use 3DMark's CPU Profile.
"Is my system healthy?" Run Novabench for a quick full-system check, then HWiNFO during a Cinebench run to watch temperatures. "What exactly is in this machine?" CPU-Z answers in seconds.
For upgrade decisions, combine two tools: a benchmark for the score and HWiNFO for thermals. A fast chip that thermal-throttles in your case is not actually fast.
Run benchmarks under consistent conditions for meaningful results. Close background applications, let the system cool to idle temperatures first, and run the test at least twice to confirm the score. Laptops on battery power score lower than plugged in, and a dusty heatsink can cost you ten percent before you even start comparing chips.
Frequently asked questions
What is CPU benchmark software?
CPU benchmark software runs standardized workloads against a processor and produces scores that let you compare performance across chips. Common tests measure single-core speed, multi-core throughput, rendering, and gaming performance.
Which CPU benchmark is the most accurate?
No single benchmark is most accurate; accuracy depends on matching the test to your workload. Cinebench for rendering, 3DMark for gaming, Geekbench for general cross-platform comparison, and PassMark for deep multi-threaded analysis.
Geekbench vs Cinebench: which should I use?
Use Geekbench for quick cross-platform comparisons across phones, laptops, and desktops. Use Cinebench for rendering and content-creation workloads where sustained multi-core performance matters. Many reviewers run both.
Are free CPU benchmarks reliable?
Yes. Geekbench, Cinebench, Novabench, CPU-Z, and HWiNFO are free and widely trusted. Paid tools like 3DMark and PassMark add gaming-specific tests and deeper databases, but the free tools cover most needs.
How do I check CPU temperature during a benchmark?
Run HWiNFO alongside your benchmark to monitor per-core temperatures in real time. AIDA64 combines stress testing with sensor monitoring in one tool. Watch for thermal throttling, which reduces performance under sustained load.
What is a good Cinebench 2026 score?
Scores depend on the version and cannot be compared across versions. Check the Geekbench Browser or PassMark charts for your specific chip to see how it ranks against identical hardware running the same benchmark version.
Sources we checked (5)
- https://en.wikipedia.org/wiki/Geekbench
- https://www.newsy-today.com/cinebench-2026-released-new-industry-benchmark-for-cpu-gpu-performance/
- https://www.appleinsider.com/articles/26/07/23/new-geekbench-7-benchmark-adds-ai-workloads-better-reflects-2026-computer-use-cases
- https://www.ghacks.net/2017/08/30/novabench-4-0-review-windows-benchmark-software/
- https://techdows.com/download-cpu-z-for-pc-windows-11-10-mac.html
Is your product missing or out of date?
We review this list regularly. Vendors can request a listing, send updated pricing or ask about featured placement.

Shihab Mia · Founder, Rankite
Shihab has spent more than a decade helping SaaS and e-commerce brands grow through search. He writes Rankite's software buying guides from pricing pages, documentation and public user reviews. More about Shihab.