How we make this list: we compare pricing pages, product documentation and public user reviews. Ratings come from G2, Capterra or Trustpilot, with the date we checked them.
Key takeaways
- Datadog's per-host plus per-module pricing adds up fast, so teams leave for usage-based billing, open-source portability, or simpler pricing.
- New Relic is the closest usage-based replacement with a generous free data allowance, while Grafana Cloud suits open-source teams that want portable dashboards.
- Dynatrace suits large enterprises drowning in alerts, with AI root cause analysis that cuts noise to a single cause.
- Coralogix suits high-host estates with its per-GB pricing and no per-host or per-user fees, while SigNoz suits teams that want to self-host for free.
- The pricing unit decides your bill: per-host, per-GB, per-series, and per-user meters all grow differently as you scale.
Quick comparison
| Tool | Best for | Starting price | Free plan |
|---|
 New Relic | Usage-based full platform | Free; then usage-based | Yes |
 Dynatrace | AI root cause analysis | See website | Free trial |
 Grafana Cloud | Open-source dashboards | $19/month | Yes |
 Splunk Observability | Enterprise Splunk shops | $15/host/month | Free trial |
 Elastic Observability | Search-based observability | $95/month | Free trial |
 Honeycomb | Trace-first debugging | Free; Pro $150/month | Yes |
 SigNoz | Open-source self-hosted APM | Free; Cloud $49/month | Yes |
 Coralogix | Per-GB pricing, no host fees | See website | Free trial |
Is your product missing or out of date?
We review this list regularly. Vendors can request a listing, send updated pricing or ask about featured placement.
The best Datadog alternatives for observability
#1New Relic
Best for: Usage-based full platform4.4/5 on
G2 (586 reviews, checked Oct 2026)
Visit newrelic.com
Starting priceFree; then usage-based
Free planYes
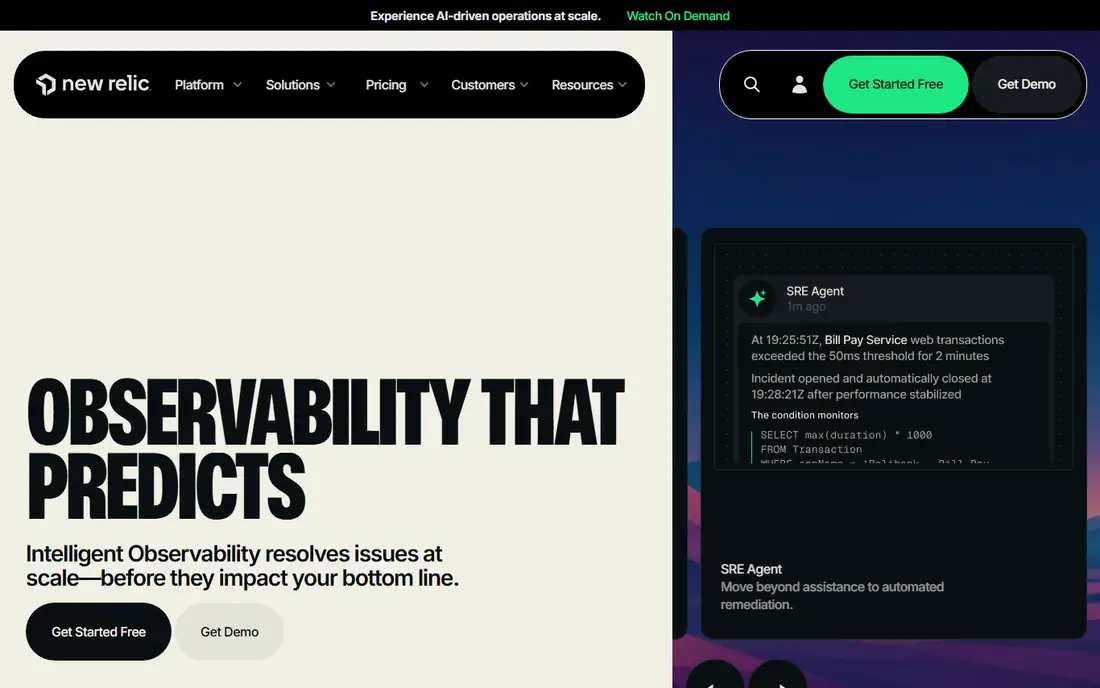
New Relic is the closest usage-based replacement for Datadog. The free tier includes 100 GB of data a month and one full user, which is enough for small teams to run real observability without paying. Beyond that, data is billed per GB, around $0.40 a GB in 2026 comparisons, with per-user seats on paid tiers. There are no per-host fees, which suits containerized estates where host counts change constantly and Datadog's per-host billing would grow with every new container host.
Coverage spans APM, infrastructure, logs, browser and mobile monitoring, and synthetics, so most teams can replace Datadog entirely. The pricing model rewards teams that control ingest volume with sampling and drop rules. For teams that want usage-based billing with a genuinely useful free tier, New Relic is the strongest Datadog alternative.
What we like- 100 GB of free data a month
- Usage-based pricing with no per-host fees
- Full platform coverage
Watch out for- Per-user seats add cost on paid tiers
- Data beyond the free allowance is billed per GB
- Enterprise pricing is custom
#2Dynatrace
Best for: AI root cause analysis4.5/5 on
G2 (1,371 reviews, checked Oct 2026)
Visit dynatrace.com
Starting priceSee website
Free planFree trial
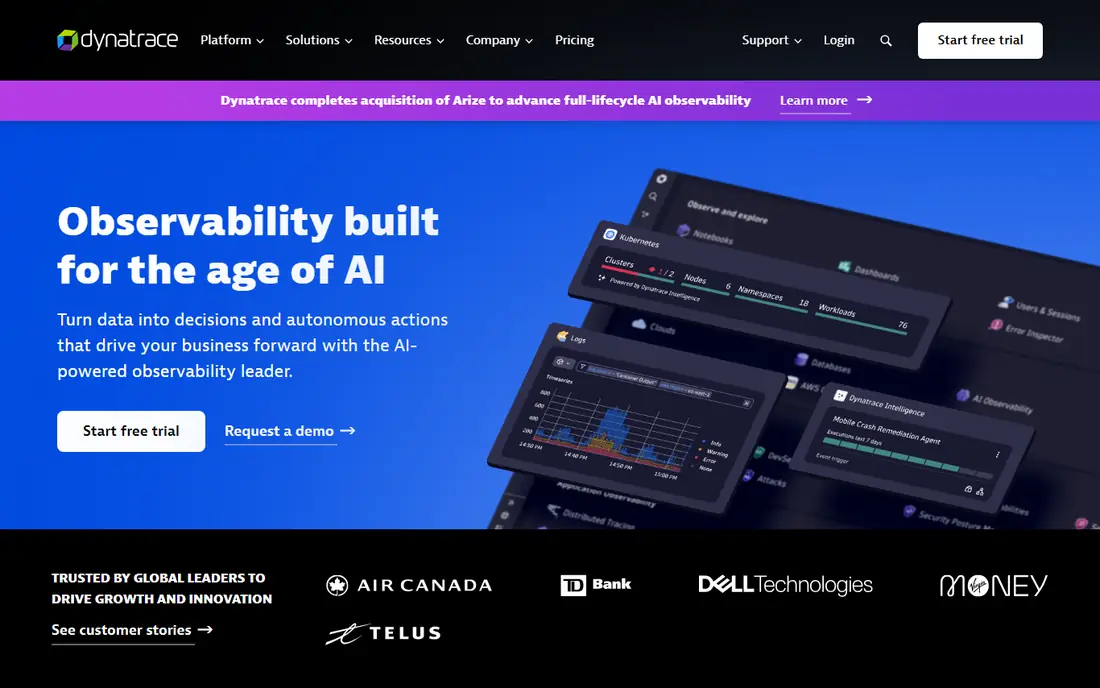
Dynatrace is the enterprise alternative for teams drowning in alerts. Its OneAgent automatically discovers services, dependencies, and topology, and its Davis AI correlates problems to a single root cause instead of flooding engineers with dozens of alerts. Full-stack monitoring runs around $0.08 an hour per 8 GiB host in 2026 comparisons, with consumption-based units for newer pricing.
The platform is powerful but complex, and pricing needs careful modeling. Smaller teams may find it more than they need, while large enterprises with hundreds of services get the most value from automatic discovery and root cause analysis. For large estates where alert noise is the main pain that Datadog did not solve, Dynatrace is the best fit.
What we like- Automatic discovery and mapping
- AI root cause analysis reduces alert noise
- Strong enterprise governance
Watch out for- Pricing is complex and consumption-based
- Best value at enterprise scale
- Smaller teams may overpay
#3Grafana Cloud
Best for: Open-source dashboards4.5/5 on
G2 (220 reviews, checked Oct 2026)
Visit grafana.com
Starting price$19/month
Free planYes
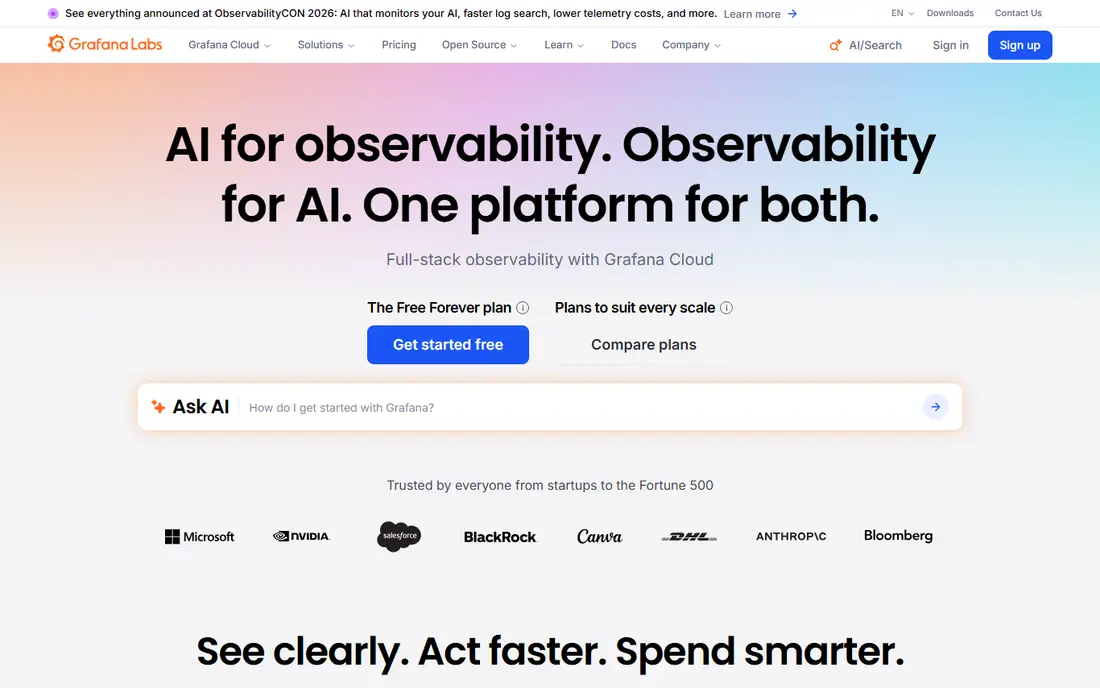
Grafana Cloud is the managed version of the open-source observability stack that many engineers already know, and the best choice for teams that want to escape vendor lock-in. The Pro tier starts at $19 a month plus usage, with logs around $0.40 a GB written and metrics billed per active series, and a free tier covers small use. Dashboards built in Grafana are portable: if you ever leave Grafana Cloud, the same dashboards run on self-hosted Grafana, which is not true of Datadog's dashboards.
The trade-off is assembly. Logs, metrics, and traces are separate backends, Loki, Mimir, and Tempo, and wiring them together takes more skill than a single-vendor platform. Usage meters also need monitoring as series counts grow. For teams that value open source, portability, and dashboard quality, Grafana Cloud is the best Datadog alternative.
What we like- Built on open-source Grafana, Loki, Mimir, and Tempo
- Portable dashboards and alerts
- Generous free tier
Watch out for- Usage meters for logs, metrics, and traces add up
- Assembling the full stack takes skill
- Enterprise features are paid
#4Splunk Observability
Best for: Enterprise Splunk shops4.3/5 on
G2 (55 reviews, checked Oct 2026)
Visit splunk.com
Starting price$15/host/month
Free planFree trial
Splunk Observability Cloud suits enterprises that already run Splunk for log management and security. Infrastructure monitoring starts at $15 a host a month, application plus infrastructure at $60, and end-to-end observability at $75, with log ingest priced separately. Teams with Splunk expertise and existing Splunk data can extend one platform rather than adopting another vendor, and security teams get SIEM integration that Datadog's security products only partly match.
The per-host tiers rise steeply, and log ingest pricing on top means the total bill needs modeling. Licensing complexity is a known Splunk complaint. For organizations already invested in Splunk, the observability cloud is a natural extension; for new buyers, New Relic or Grafana Cloud is usually simpler and cheaper.
What we like- Strong log and security heritage
- Per-host tiers are clear
- Good for enterprises already on Splunk
Watch out for- Per-host tiers rise steeply for full coverage
- Log ingest is priced separately
- Complex licensing
Starting price$95/month
Free planFree trial
Elastic Observability is built on Elasticsearch, which gives it powerful search across logs, metrics, and traces. Cloud pricing starts around $95 a month in 2026 comparisons, with compute-capacity tiers for larger estates, and the open-source components can be self-hosted for free apart from infrastructure costs. Teams that already operate Elasticsearch get observability almost as a side effect, and search-first analysis suits log-heavy investigations.
Running Elasticsearch well takes skill: index management, shard sizing, and retention policies all need attention. The platform is less of a turnkey APM than Datadog or Dynatrace. For teams with Elasticsearch expertise that want search-first observability, Elastic is a strong fit.
What we like- Search-powered log and APM analysis
- Open-source roots
- Flexible deployment from cloud to self-hosted
Watch out for- Needs Elasticsearch operational skill
- Cloud pricing starts higher than rivals
- Tuning takes effort
#6Honeycomb
Best for: Trace-first debugging4.5/5 on
G2 (37 reviews, checked Oct 2026)
Visit honeycomb.io
Starting priceFree; Pro $150/month
Free planYes
Honeycomb takes a different approach from Datadog: instead of pre-aggregated metrics and dashboards, it stores wide events and lets engineers query them interactively to debug production problems. The free tier covers 20 million events, and Pro starts at $150 a month. High-cardinality data, such as per-user or per-request attributes, is where Honeycomb shines, since it does not force you to drop dimensions before ingest, a limitation that frustrates Datadog users with cardinality bills.
The model takes adjustment for teams used to dashboard-first monitoring, and log coverage is thinner than full-platform rivals. For engineering teams debugging complex distributed systems, where the question is always what was different about the failing requests, Honeycomb is the best debugging tool in this guide, and it complements rather than replaces a dashboard platform for some teams.
What we like- Best-in-class high-cardinality tracing
- Free tier covers 20 million events
- Fast query on wide events
Watch out for- Trace-first model differs from dashboard-first tools
- Pro starts higher than some rivals
- Log coverage is thinner
Starting priceFree; Cloud $49/month
Free planYes
SigNoz is the open-source APM alternative that teams can self-host for free, paying only infrastructure costs, or run on SigNoz Cloud from $49 a month. It is OpenTelemetry-native, covering metrics, traces, and logs in one interface, and it avoids the per-host and per-user meters that drive up Datadog bills. For a team that wants Datadog-style APM without Datadog-style pricing, SigNoz is the most direct open-source answer.
Self-hosting needs operational effort, and the community and integration catalog are smaller than Grafana's. For teams that want open-source observability with a single interface and a low-cost cloud path, SigNoz is the best value in this guide, and a good hedge against vendor lock-in since the code is open.
What we like- Open source and OpenTelemetry-native
- Self-host for free
- Cloud option from $49 a month
Watch out for- Smaller community than Grafana
- Self-hosting needs operational effort
- Fewer native integrations
Starting priceSee website
Free planFree trial
Coralogix is the pricing-model alternative for high-host estates: logs around $0.42 a GB, traces around $0.16 a GB, and metrics around $0.05 a GB ingested, with no per-host or per-user fees at all. For a containerized estate where Datadog's per-host billing grows with every host, Coralogix's volume-based model can cost far less. Tiered storage lets teams pay less for compliance data that is rarely queried, and archive storage in the customer's own S3 keeps data ownership with the customer.
The pipeline-based pricing model takes learning, since data is split across frequent search, monitoring, and compliance tiers at different rates, and the ecosystem is smaller than Datadog's. For high-host, controlled-volume estates, Coralogix is the most cost-effective Datadog alternative.
What we like- Per-GB pricing with no per-host or per-user fees
- Tiered storage by data value
- Customer-owned archive storage
Watch out for- Pipeline-based pricing takes learning
- Smaller ecosystem than Datadog
- SIEM features are newer
How we chose
We compared observability platforms that replace Datadog's core job: collecting logs, metrics, and traces, and turning them into alerts and answers about production systems. We weighed signal coverage, pricing model, deployment options, OpenTelemetry support, and ecosystem from vendor pages and 2026 observability comparisons. We left out pure uptime monitors and narrow log tools. Where pricing depends on volume or host counts, we list the published starting figure and note that the real bill depends on ingest.
How to pick a Datadog replacement
Start with your pricing unit and your pain. If Datadog's per-host bill is the problem, shortlist New Relic, Coralogix, and SigNoz. If alert noise is the problem, shortlist Dynatrace. If lock-in is the problem, shortlist Grafana Cloud and SigNoz. If you already run Splunk or Elasticsearch, shortlist those platforms. If debugging is the problem, shortlist Honeycomb. Measure your current ingest volume, host count, and series cardinality before comparing, since the same workload can cost twice as much on one meter as another.
Control ingest before you migrate
Observability bills are driven by data volume, and most teams ingest far more than they query. Before migrating, set sampling rules, drop debug logs in production, and set retention by data value. A migration that copies every log verbatim will cost more than the old bill on any platform, including the cheaper ones here.
Test with real cardinality
Metrics bills grow with cardinality: every new label value creates new series. Test each candidate with your real label set, including high-cardinality dimensions like user IDs or request paths, and watch the series count. A platform that looks cheap on a demo can become expensive once your real labels arrive, which is exactly how Datadog bills surprise teams.
Frequently asked questions
Why do teams leave Datadog?
The most common reason is cost: per-host plus per-module plus per-GB meters compound, and bills grow far beyond the starting price as hosts, modules, and log volume increase. Other reasons are ecosystem fit, since teams standardize on Grafana or Splunk, and a desire for usage-based or open-source pricing. Evaluate your own volume and host count rather than following a trend.
Is New Relic cheaper than Datadog?
For many teams, yes, especially those with high host counts and controlled ingest volume, since New Relic has no per-host fees and a 100 GB free allowance. For teams with very high ingest volume, per-GB billing can still grow large. Model both bills against your real volume and host count before deciding.
Can I self-host observability for free?
Yes, with SigNoz or the Grafana stack, you pay only infrastructure costs. The trade-off is operational effort: upgrades, scaling, retention, and backups become your job. For small teams with spare engineering capacity, self-hosting is excellent value; for teams without it, a managed cloud tier is cheaper than the engineering time.
What is OpenTelemetry, and why does it matter?
OpenTelemetry is the open standard for collecting traces, metrics, and logs, supported by every tool in this guide. Using it means your instrumentation is portable: you can switch observability backends without rewriting code. Prefer tools with native OpenTelemetry support, and instrument with OpenTelemetry from the start to keep your exit options open.
How do I avoid surprise observability bills?
Set ingest budgets, sampling rules, and spend alerts before production traffic arrives. Monitor series counts and log volume weekly, and review the bill monthly against the budget. Most surprise bills come from a new service emitting high-cardinality metrics or debug logs at scale, so alert on volume changes per service.
Sources we checked (8)
- https://newrelic.com
- https://www.dynatrace.com
- https://grafana.com
- https://www.splunk.com
- https://www.elastic.co
- https://www.honeycomb.io
- https://signoz.io
- https://coralogix.com
Is your product missing or out of date?
We review this list regularly. Vendors can request a listing, send updated pricing or ask about featured placement.

Shihab Mia · Founder, Rankite
Shihab has 5+ years in B2B and SaaS SEO. He writes Rankite's software buying guides from pricing pages, documentation and public user reviews. More about Shihab.