How we make this list: we compare pricing pages, product documentation and public user reviews. Ratings come from G2, Capterra or Trustpilot, with the date we checked them.
Key takeaways
- This list leans toward paid and managed monitoring options, as the search intent asks, with open-source tools included where they solve a clear cost or control problem.
- Datadog, New Relic, and Dynatrace suit teams that want full-stack observability, APM, logs, and traces in one managed platform, with support included.
- Grafana Cloud, VictoriaMetrics, and SigNoz suit teams that like Prometheus-style metrics but want managed hosting, longer retention, or lower ingest costs.
- Pricing models differ more than feature lists do, so compare per-host, per-user, and per-gigabyte costs against your actual hosts, users, and log volume before choosing.
Quick comparison
| Tool | Best for | Starting price | Free plan |
|---|
 Datadog | Full-stack managed observability | $15 per user/month | Free trial |
 Grafana Cloud | Managed Prometheus-style metrics | $29 per user/month | Yes |
 New Relic | All-in-one observability per user | See website | Yes |
 Dynatrace | Enterprise AI-driven monitoring | See website | Free trial |
 Splunk Observability | Logs, metrics, and security at scale | See website | Free trial |
 LogicMonitor | Infrastructure monitoring with automation | See website | Free trial |
 SigNoz | OpenTelemetry-native observability | $199 per user/month | Yes |
 VictoriaMetrics | High-volume metrics storage | See website | Yes |
 Zabbix | Self-hosted infrastructure monitoring | Free | Yes |
 InfluxDB | Time-series data for metrics and events | See website | Yes |
Is your product missing or out of date?
We review this list regularly. Vendors can request a listing, send updated pricing or ask about featured placement.
The best Prometheus alternatives
#1Datadog
Best for: Full-stack managed observability4.4/5 on
G2 (726 reviews, checked Oct 2026)
Visit datadoghq.com
Starting price$15 per user/month
Free planFree trial
Datadog is the most common paid move for teams leaving self-hosted Prometheus. It collects infrastructure metrics, application traces, logs, synthetic checks, and real user monitoring in one dashboard, with hundreds of integrations for cloud services, databases, and queues. For Kubernetes teams, auto-discovery and service maps reduce the manual config that Prometheus setups often require. Support, retention, and alerting arrive as managed services, which frees a small platform team from running storage and alert routing.
Cost is the main reason teams hesitate. The entry infrastructure price near $15 per host per month is only a starting point, since APM, logs, synthetics, and real user monitoring add separate charges. A team with high log volume can see a bill several times larger than the host count suggests. Datadog fits best when observability is a core need, the team can forecast usage, and the value of one platform outweighs a higher, usage-based bill.
What we like- Broad integrations
- Metrics, logs, traces, and synthetics in one platform
- Strong Kubernetes support
Watch out for- Costs rise fast as hosts, logs, and APM add up
- Pricing needs careful forecasting
#2Grafana Cloud
Best for: Managed Prometheus-style metrics4.5/5 on
G2 (220 reviews, checked Oct 2026)
Visit grafana.com
Starting price$29 per user/month
Free planYes
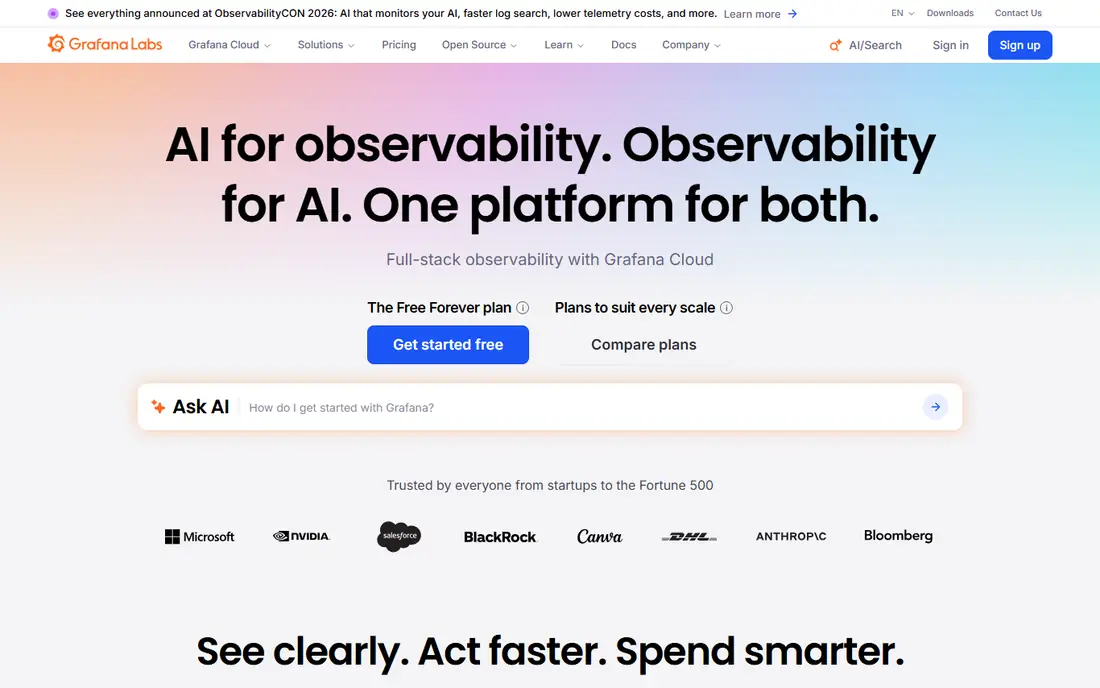
Grafana Cloud appeals to teams that like Prometheus but no longer want to run it. It offers managed Prometheus-compatible metrics, plus Loki for logs and Tempo for traces, with Grafana dashboards on top. Existing PromQL queries, exporters, and dashboards often carry over with limited changes, which lowers migration risk. A free tier covers small projects, and paid tiers add higher limits and support.
Grafana Cloud is not a single flat price. The Pro tier starts near $29 per month, but usage beyond included metrics, logs, and traces adds cost, so teams still need to watch cardinality and log volume. The product set also spans several tools, which can feel complex at first. For teams that want managed Prometheus without giving up PromQL, Grafana Cloud is the most direct paid path.
What we like- Familiar PromQL and dashboards
- Managed metrics, logs, and traces
- Free tier for small use
Watch out for- Usage costs still need monitoring
- Full setup spans several products
#3New Relic
Best for: All-in-one observability per user4.4/5 on
G2 (586 reviews, checked Oct 2026)
Visit newrelic.com
Starting priceSee website
Free planYes
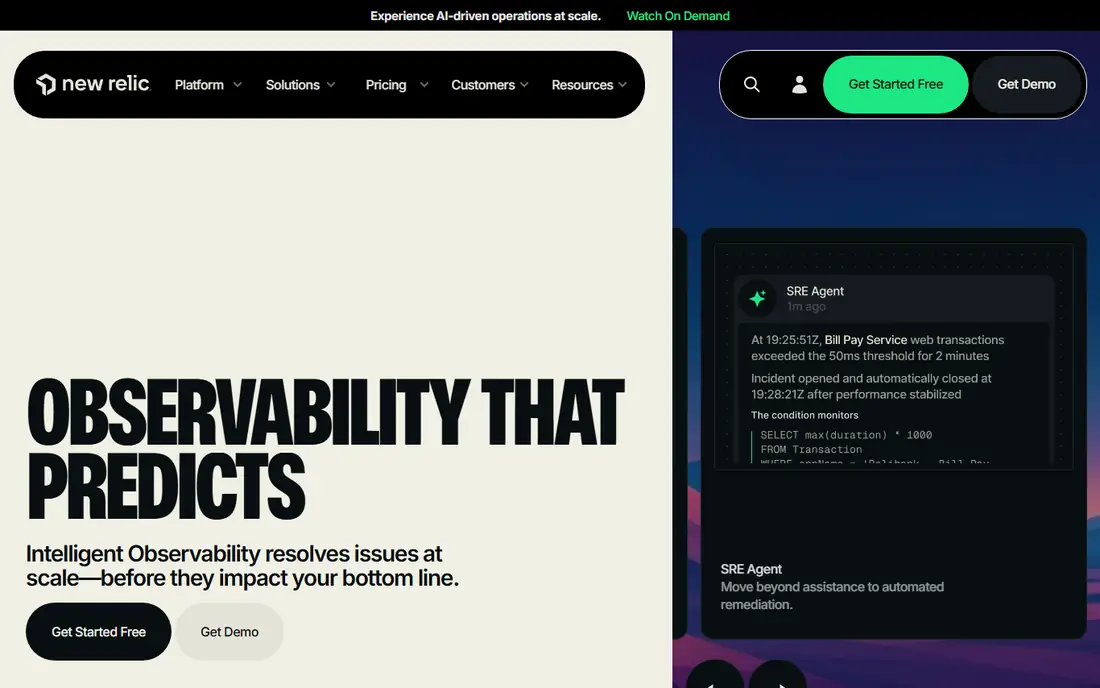
New Relic takes a different pricing approach from Datadog. Instead of charging per feature, it charges mainly per full platform user and per gigabyte of data beyond the free allowance. That model means a small team can use APM, infrastructure monitoring, logs, and synthetics without buying each product separately. The free tier, with 100 GB of data per month and one full user, is genuinely useful for small projects and trials.
Team growth changes the maths. Adding full users raises the bill even when host count stays flat, and data overages add cost for log-heavy systems. New Relic suits teams that want one platform, predictable feature access, and a clear free starting point. It suits less well teams with many occasional viewers who would need full user seats to access core features.
What we like- All features available on paid plans
- Generous free data allowance
- Strong APM and dashboards
Watch out for- Per-user pricing can grow with team size
- Data overage charges need attention
#4Dynatrace
Best for: Enterprise AI-driven monitoring4.5/5 on
G2 (1,371 reviews, checked Oct 2026)
Visit dynatrace.com
Starting priceSee website
Free planFree trial
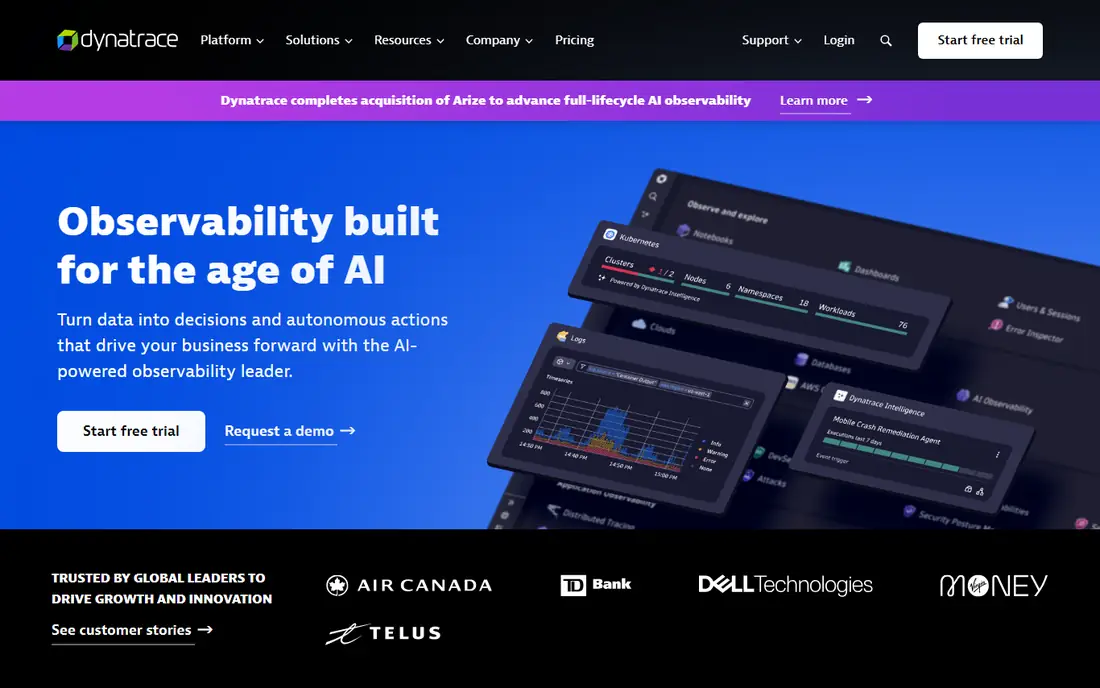
Dynatrace targets large, complex estates where manual instrumentation is impractical. Its OneAgent auto-discovers services, hosts, and dependencies, and its AI engine links problems to likely root causes across metrics, traces, and logs. For enterprises running hundreds of services across cloud and on-premise systems, that automation saves weeks of setup and reduces alert noise. Security and business analytics features extend the platform beyond basic monitoring.
Pricing follows a consumption model, so a simple per-host comparison with Datadog or New Relic can mislead. Small teams may also find the platform larger than they need, with features they will not use in the first year. Dynatrace fits best when scale, automation, and root cause analysis justify an enterprise platform and a sales-led pricing discussion.
What we like- Automatic instrumentation with OneAgent
- AI-assisted root cause analysis
- Full-stack coverage
Watch out for- Consumption pricing is complex
- Enterprise focus may exceed small team needs
#5Splunk Observability
Best for: Logs, metrics, and security at scale4.3/5 on
G2 (55 reviews, checked Oct 2026)
Visit splunk.com
Starting priceSee website
Free planFree trial
Splunk Observability combines Splunk's log strength with metrics, traces, and real user monitoring. Teams that already use Splunk for security or log analysis can add observability without a second vendor, and the search language supports deep log investigation. For large estates with compliance needs, retention controls and access management matter as much as dashboards, and Splunk covers those areas well.
The main drawback is pricing clarity. Workload-based pricing depends on data volume, hosts, and features in ways that need a detailed quote to forecast. New users also need time to learn Splunk's query language. Splunk fits enterprises and security-conscious teams with large log volumes. Smaller teams with a metrics-first need will usually find Grafana Cloud or SigNoz simpler and cheaper.
What we like- Strong log search and analytics
- Metrics and traces alongside logs
- Security use cases included
Watch out for- Pricing is workload-based and hard to forecast
- Learning curve for query language
#6LogicMonitor
Best for: Infrastructure monitoring with automation4.5/5 on
G2 (643 reviews, checked Oct 2026)
Visit logicmonitor.com
Starting priceSee website
Free planFree trial
LogicMonitor focuses on infrastructure monitoring for hybrid estates. It auto-discovers servers, network devices, storage, and cloud resources, then applies monitoring templates without manual per-device setup. That automation helps IT teams that manage a mix of on-premise hardware and cloud services, where Prometheus exporters would need more hand-built config. Dashboards, alerting, and reporting sit in one managed platform.
Pricing is quote-based, so buyers must talk to sales for a firm figure, which slows comparison. Application performance depth also varies by stack, and teams with heavy APM needs may prefer Datadog, New Relic, or Dynatrace. LogicMonitor suits infrastructure-led teams, managed service providers, and hybrid estates where device coverage and automation matter most.
What we like- Broad device and cloud coverage
- Automated discovery
- Alerting and dashboards in one platform
Watch out for- Quote-based pricing
- Less APM depth than Datadog or New Relic for some stacks
Starting price$199 per user/month
Free planYes
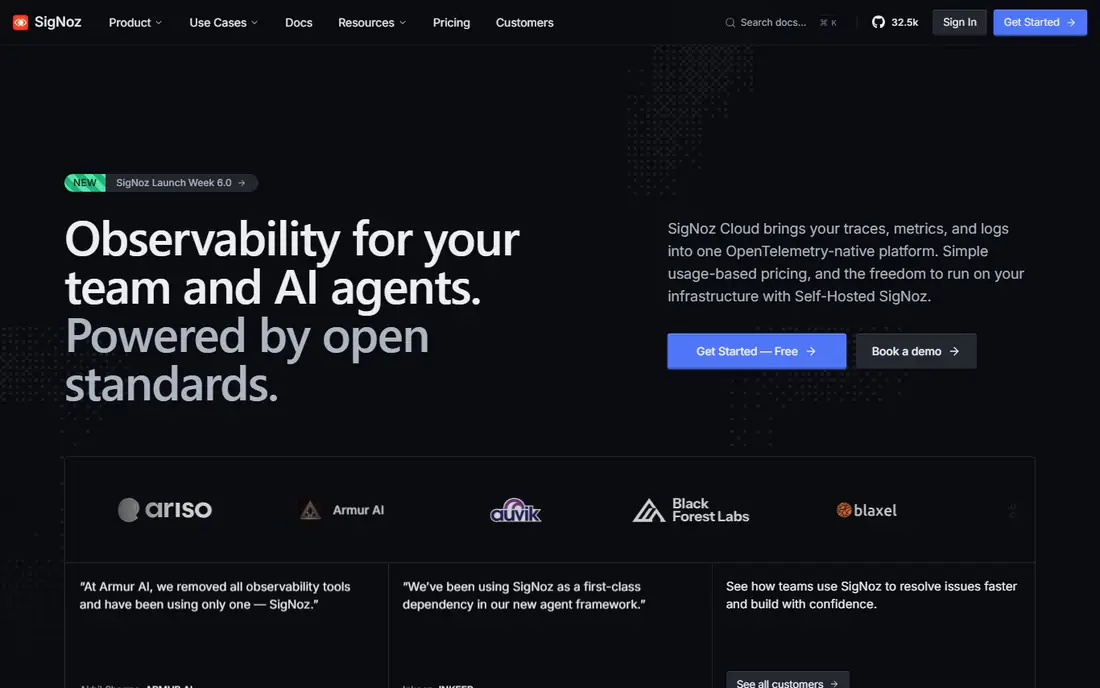
SigNoz is built around OpenTelemetry, the open standard for traces, metrics, and logs. That design helps teams that want to instrument once and keep the option to change backends later. It combines metrics, logs, and traces in one interface, with dashboards and alerts that feel familiar to Prometheus and Grafana users. A self-hosted open-source version is free, while the managed cloud team plan starts near $199 per month.
The cloud price puts SigNoz above Grafana Cloud for small teams, even though self-hosting is free. Its ecosystem and integration count are also smaller than Datadog's. SigNoz fits teams that have adopted OpenTelemetry, want a single open-source-leaning platform, and can either self-host or justify the cloud team price for managed hosting and support.
What we like- OpenTelemetry native
- Metrics, logs, and traces in one UI
- Self-hosted option available
Watch out for- Cloud team plan starts at $199 per month
- Smaller ecosystem than Datadog
Starting priceSee website
Free planYes
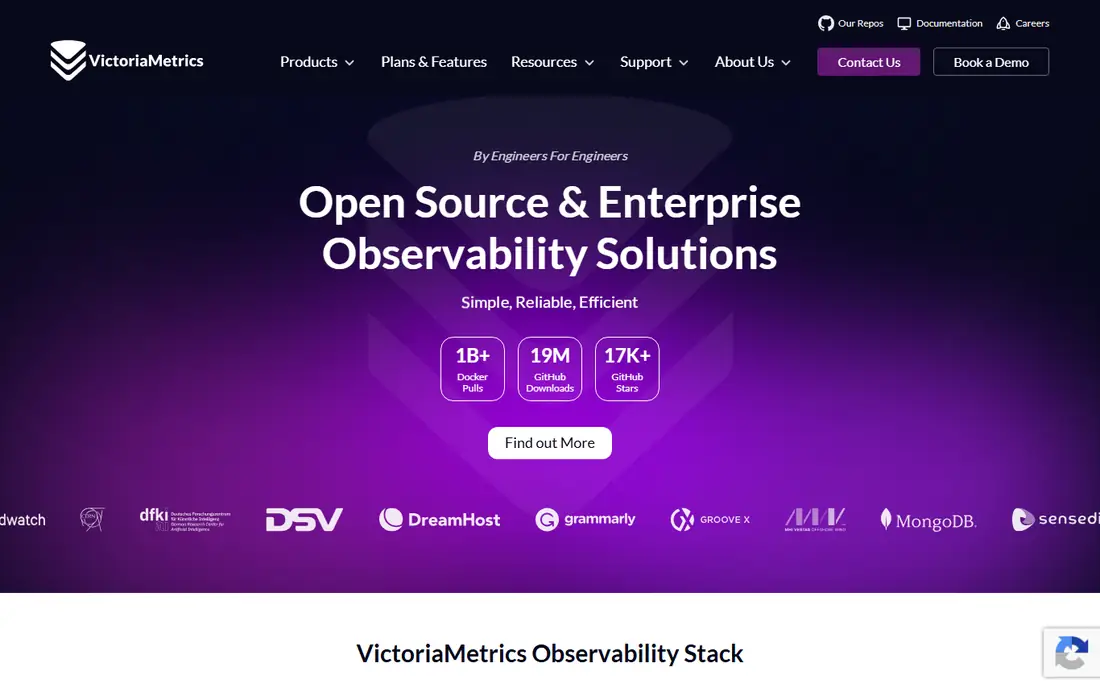
VictoriaMetrics solves a specific Prometheus pain point: storage cost and performance at high metric volume. It accepts Prometheus-compatible data, stores it efficiently, and handles high-cardinality series better than a single Prometheus server in many cases. Teams often pair it with Grafana for dashboards and Alertmanager-style alerting. A free open-source version and a managed cloud option give teams a choice between control and convenience.
VictoriaMetrics is not a full observability platform on its own. It does not replace APM, log search, or real user monitoring, so teams that need those features must add other tools. It fits best when metrics volume, retention, or query speed is the bottleneck, and the team is happy to keep Grafana for visualisation. For that narrow but common problem, it is a strong paid or self-hosted alternative.
What we like- Efficient storage for high-cardinality metrics
- Prometheus-compatible queries
- Self-hosted and cloud options
Watch out for- Mainly a metrics backend, not a full observability suite
- Needs Grafana or another UI for dashboards
#9Zabbix
Best for: Self-hosted infrastructure monitoring4.3/5 on
G2 (209 reviews, checked Oct 2026)
Visit zabbix.com
Starting priceFree
Free planYes
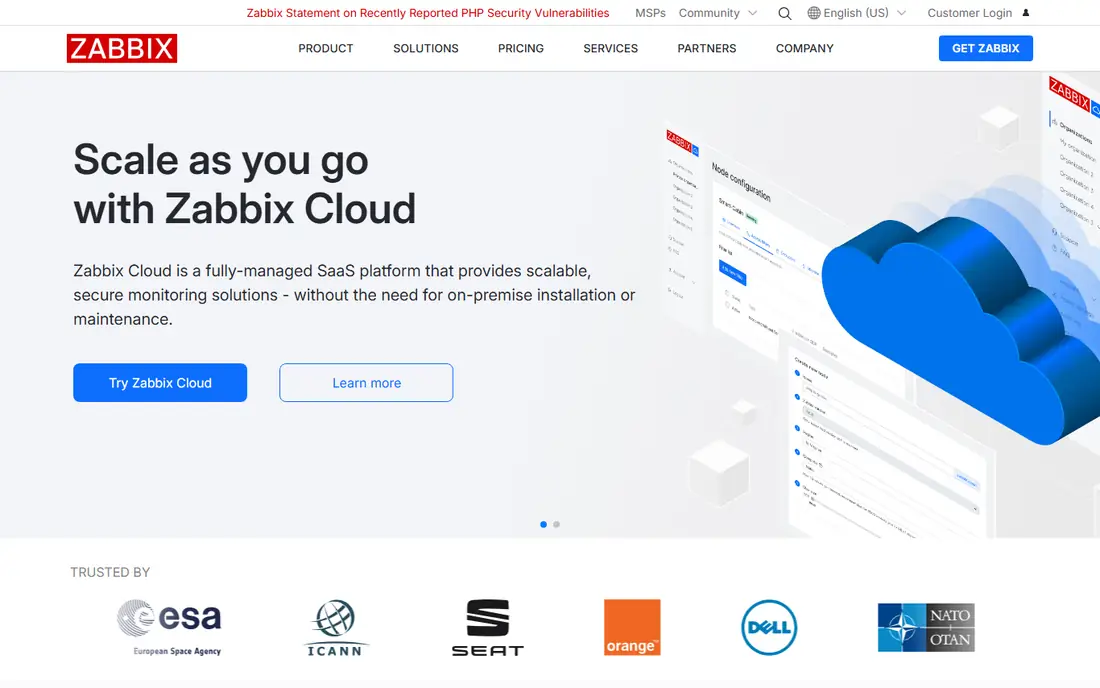
Zabbix is a long-running open-source monitor for servers, networks, and services. It offers templates for common devices, triggers for alerting, and dashboards for infrastructure health, all without a licence fee. Organisations that need to monitor on-premise hardware, network gear, and services under strict data control often prefer Zabbix to a cloud platform. Support and managed options exist for teams that want help without moving to SaaS.
Running Zabbix is the trade-off. Your team owns installation, upgrades, scaling, and alert tuning, which is the same burden that pushes many teams away from self-hosted Prometheus. Application tracing is also thinner than in APM platforms. Zabbix fits infrastructure teams with on-premise estates and in-house skills, especially where a free licence and data control outweigh the appeal of a managed platform.
What we like- Free and open source
- Broad infrastructure and network monitoring
- Templates for many devices
Watch out for- Setup and maintenance fall on your team
- Interface feels dated
- APM coverage is limited
#10InfluxDB
Best for: Time-series data for metrics and events4.5/5 on
G2 (102 reviews, checked Oct 2026)
Visit influxdata.com
Starting priceSee website
Free planYes
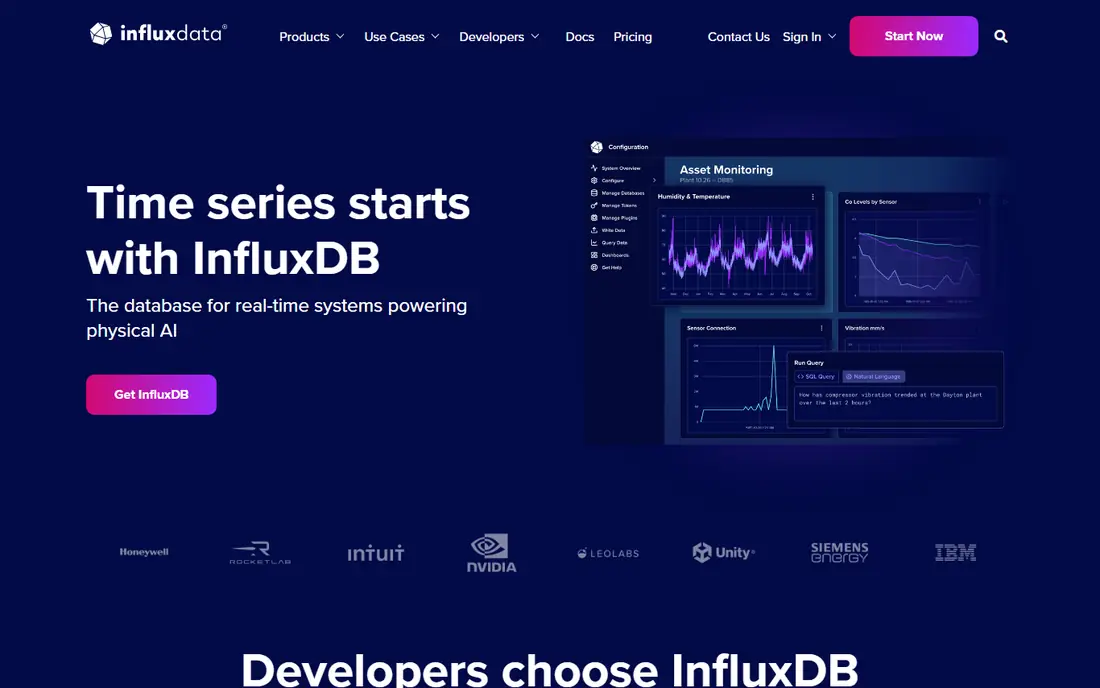
InfluxDB is a time-series database rather than a drop-in Prometheus replacement. It stores metrics and events with timestamps, handles high-frequency data from sensors and services, and offers cloud and self-hosted editions. Teams in IoT, manufacturing, and real-time analytics use it where Prometheus retention or query patterns fit less well. A free tier and open-source edition let teams test it without a large commitment.
A full monitoring setup needs more pieces. Dashboards, alerting, and service discovery usually come from Grafana, Kapacitor, or other tools, and the query language differs from PromQL, so migration takes work. InfluxDB fits when time-series data is the core need and the team can build visualisation around it. For a ready-made Prometheus alternative, Grafana Cloud or a full observability platform will be faster.
What we like- Purpose-built time-series database
- Strong for IoT and high-frequency metrics
- Cloud and self-hosted options
Watch out for- Needs a separate UI and alerting setup for full monitoring
- Query language differs from PromQL
How we chose
We compared vendor pricing pages, product documentation, and public reviews on G2, Capterra, and Reddit, and we checked each tool for metrics, logs, traces, APM coverage, hosting model, and pricing structure. We leaned toward paid and managed options, as the keyword intent asks, while keeping open-source tools that solve cost, control, or volume problems. We did not claim hands-on testing, and we avoided tools with unclear pricing or discontinued products.
We also weighed fit by team size and estate type. A startup with ten hosts needs a different platform from an enterprise with hybrid infrastructure, so the list mixes per-host, per-user, and usage-based pricing rather than ranking on price alone. Where a price could not be confirmed on the vendor site at the time of writing, we wrote See website instead of guessing.
Comparing paid Prometheus alternatives without a surprise bill
Map your three cost drivers first
Before you request quotes, count your hosts, your full platform users, and your monthly log and metric volume. Datadog charges mainly by host and feature, New Relic by user and data, and Dynatrace and Splunk by consumption or workload. A tool that looks cheap on one driver can look costly on another, so a short usage audit prevents the most common billing surprise.
Run a dual-write trial before you migrate alerts
Keep Prometheus running while you send the same metrics to the new platform for two to four weeks. Compare dashboards, alert timing, and query results, and move alerts only after the new platform matches Prometheus on real incidents. This dual run costs extra for a month, but it protects on-call teams from a gap during migration. It also reveals cardinality or log volume problems before they reach a paid bill.
Standardise on OpenTelemetry where you can
Instrument new services with OpenTelemetry rather than a vendor agent alone. That choice keeps traces, metrics, and logs portable if you change platforms later, and it works with SigNoz, Grafana Cloud, Datadog, and New Relic. Vendor agents still add value for auto-discovery, but OpenTelemetry gives you an exit route that pure agent setups lack.
Frequently asked questions
What is the best paid alternative to Prometheus?
Datadog is the most complete paid replacement for teams that want metrics, APM, logs, and traces in one managed platform. New Relic suits teams that prefer per-user pricing with all features included. Grafana Cloud suits teams that want to keep PromQL and Prometheus-style workflows with managed hosting.
Can I keep using PromQL with a Prometheus alternative?
Yes, with Grafana Cloud and VictoriaMetrics, both of which support Prometheus-compatible queries. Datadog, New Relic, Dynatrace, and Splunk use their own query languages, so migration there means rewriting dashboards and alerts. Check query compatibility early if you have many existing PromQL rules.
Is Grafana a replacement for Prometheus?
Grafana alone is mainly visualisation, not metrics storage, so it pairs with Prometheus, Loki, Tempo, or Grafana Cloud backends. Grafana Cloud is the managed bundle that can replace a self-hosted Prometheus setup. Self-hosted Grafana still needs a metrics backend to store and query data.
How much does Datadog cost compared with Prometheus?
Prometheus software is free, but you pay for servers, storage, and staff time to run it. Datadog starts near $15 per host per month for infrastructure monitoring, with extra charges for APM, logs, and other products. For small estates, self-hosting may cost less in cash but more in staff time. For larger estates, compare total cost, including on-call effort, not licence price alone.
Should small teams pick a free or paid alternative?
Small teams with limited hosts should start with a free tier from Grafana Cloud, New Relic, or SigNoz self-hosted, and pay only when limits or support needs force an upgrade. Paid platforms pay off when on-call reliability, retention, and support matter more than licence savings. Revisit the choice after six months, once real usage data exists.
What is the easiest migration path from Prometheus?
Grafana Cloud offers the easiest path for most Prometheus users, since it keeps PromQL, exporters, and dashboards largely intact while moving storage and alerting to a managed service. VictoriaMetrics is another low-friction backend change when storage volume is the main problem. Full platforms such as Datadog or New Relic need more migration work but offer broader APM and log coverage in return.
Sources we checked (10)
- https://www.datadoghq.com
- https://grafana.com
- https://newrelic.com
- https://www.dynatrace.com
- https://www.splunk.com
- https://www.logicmonitor.com
- https://signoz.io
- https://victoriametrics.com
- https://www.zabbix.com
- https://www.influxdata.com
Is your product missing or out of date?
We review this list regularly. Vendors can request a listing, send updated pricing or ask about featured placement.

Shihab Mia · Founder, Rankite
Shihab has 5+ years in B2B and SaaS SEO. He writes Rankite's software buying guides from pricing pages, documentation and public user reviews. More about Shihab.