How we make this list: we compare pricing pages, product documentation and public user reviews. Rankite is independent; if a vendor ever pays for a featured spot, that listing is clearly labeled Partner.
Key takeaways
- Percona PMM is the only fully open-source option here, and it costs nothing to run for MySQL, PostgreSQL and MongoDB estates.
- pgAnalyze is the specialist pick for PostgreSQL shops that want query-level tuning advice, not just charts.
- Datadog and New Relic make sense if you already use them for the rest of your stack, since database monitoring rides on the same agent and bill.
- Redgate Monitor and SolarWinds DPA are the classic DBA tools for SQL Server and Oracle estates that need deep diagnostics.
- Watch the meter: per-host, per-server and per-GB pricing punish different estates, so price the tool against your actual server count.
Quick comparison
| Tool | Best for | Starting price | Free plan |
|---|
 SolarWinds Database Performance Analyzer SolarWinds Database Performance Analyzer | Cross-platform DBA teams on SQL Server and Oracle | See website | Free trial (14 days) |
 Redgate Monitor Redgate Monitor | SQL Server estates moving to multi-platform | $1,233 per server/year (Standard) | Free trial (14 days) |
 Datadog Database Monitoring Datadog Database Monitoring | Teams already on Datadog infrastructure monitoring | $70 per database host/month (billed annually) | Free trial (14 days) |
 New Relic New Relic | Usage-based observability with a real free tier | $0.35/GB beyond free 100 GB/month | Yes (100 GB/month free) |
 Quest Foglight Quest Foglight | Oracle and SQL Server shops needing deep wait analysis | See website | Free trial (30 days) |
 pgAnalyze pgAnalyze | PostgreSQL teams that want tuning advice | $149/month (Production, 1 server) | Free trial (14 days) |
 Percona Monitoring and Management Percona Monitoring and Management | Open-source shops with MySQL, Postgres or MongoDB | Free (open source) | Yes |
 ManageEngine Applications Manager ManageEngine Applications Manager | Budget-conscious IT teams monitoring everything | From $395/year (Professional) | Yes (up to 5 monitors) |
 Dynatrace Dynatrace | Enterprises wanting automated root-cause analysis | From $0.08/host/hour | Free trial (15 days) |
Is your product missing or out of date?
We review this list regularly. Vendors can request a listing, send updated pricing or ask about featured placement.
The best database management software for maintenance
#1
SolarWinds Database Performance Analyzer
Best for: Cross-platform DBA teams on SQL Server and Oracle
Visit solarwinds.com
Starting priceSee website
Free planFree trial (14 days)
SolarWinds DPA is the tool DBAs reach for when the database is slow and the application team is pointing fingers. Its core idea is response-time analysis: it breaks down exactly where each query spends its time, whether waiting on CPU, I/O, locks or the network. That turns vague complaints into a ranked list of what to fix. It covers Oracle, SQL Server, MySQL, MariaDB, PostgreSQL, DB2 and SAP ASE, plus cloud databases on Azure, AWS and Google Cloud.
The honest catch is buying it. SolarWinds sells DPA through subscription and volume licensing, and the price depends on the database edition and instance count, so you will talk to sales. The 14-day trial is fully functional, enough to point it at your worst-performing server and see whether the wait-time view earns its keep.
What we like- Response-time analysis across Oracle, SQL Server, MySQL, PostgreSQL and DB2
- Machine-learning anomaly detection
- Tuning advisors suggest concrete fixes
Watch out for- Pricing is quote-based and varies by edition
- The interface feels dated next to cloud-native tools
#2
Redgate Monitor
Best for: SQL Server estates moving to multi-platform
Visit red-gate.com
Starting price$1,233 per server/year (Standard)
Free planFree trial (14 days)
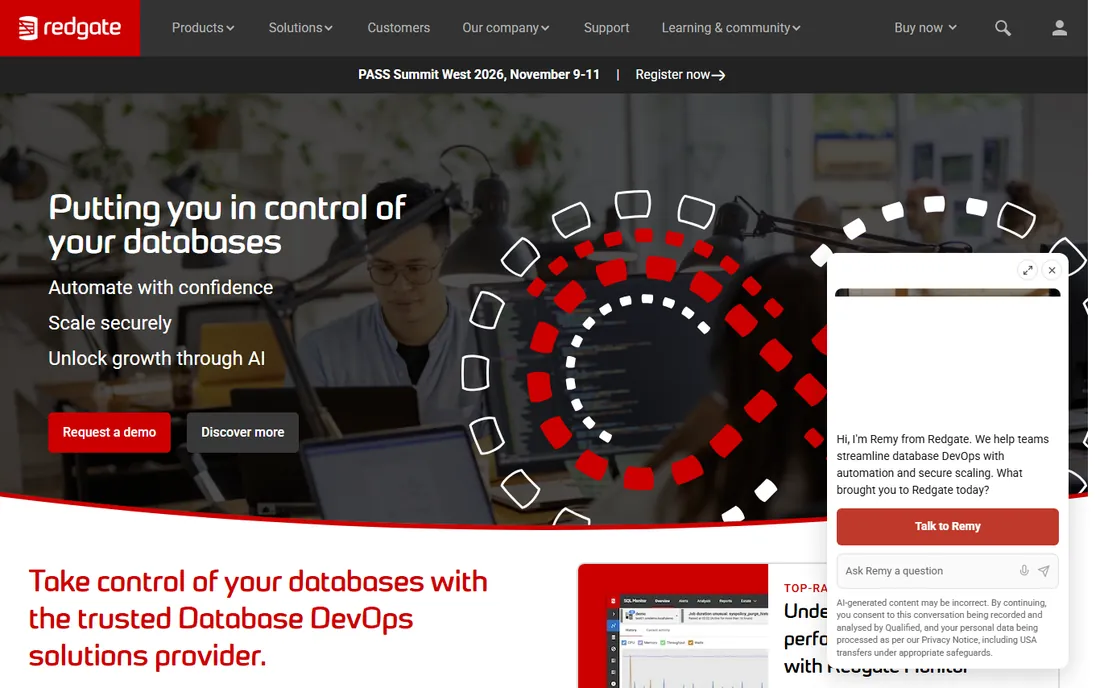
Redgate Monitor, formerly SQL Monitor, grew up as the SQL Server DBA's dashboard and has become a genuine multi-platform tool. It watches SQL Server, PostgreSQL, Oracle, MySQL and MongoDB from one web console, on-prem, in the cloud or hybrid. The Standard edition covers the core estate with overview, diagnosis, alerting and deployment tracking, while Enterprise adds security auditing, high availability and a data API. You can run it self-hosted behind your firewall or as a fully managed SaaS.
Pricing is refreshingly public: the vendor page lists Standard per server per year, with the page's own structured data showing $1,233. The 14-day trial and a live online demo make evaluation painless. The weakness is heritage. If your estate is mostly PostgreSQL or Oracle, some of the deepest diagnostics still feel SQL Server-first, and large regulated shops will need the quote-only Enterprise tier.
What we like- One dashboard for SQL Server, PostgreSQL, Oracle, MySQL and MongoDB
- Self-hosted or SaaS editions
- Clear per-server annual pricing
Watch out for- Deepest features are still SQL Server-flavored
- Enterprise tier is quote-only
#3
Datadog Database Monitoring
Best for: Teams already on Datadog infrastructure monitoring
Visit datadoghq.com
Starting price$70 per database host/month (billed annually)
Free planFree trial (14 days)
Datadog Database Monitoring is the add-on that makes sense when Datadog already watches your servers. The agent you already run starts collecting query metrics, explain plans and wait events from PostgreSQL, MySQL, SQL Server, Oracle, MongoDB and ClickHouse, self-hosted or managed. The payoff is correlation: a slow query sits next to the CPU spike, the bad deploy and the trace that called it, in one timeline. Query metrics are retained for 15 months.
The vendor pricing page lists $70 per database host per month billed annually, or $84 on-demand, with each host allotted 200 normalized queries. The fine print matters: you must already be an Infrastructure Monitoring customer, so DBM is never a standalone purchase, and a host counts as any database instance, self-hosted or cloud-managed. If Datadog is already your platform, the incremental value is high. If it is not, do not buy Datadog just for this.
What we like- Query performance correlated with infrastructure and APM traces
- Automatic explain plans and PII obfuscation
- 15-month query metric retention
Watch out for- Requires Datadog Infrastructure Monitoring first
- Per-host pricing stacks up on large estates
Starting price$0.35/GB beyond free 100 GB/month
Free planYes (100 GB/month free)
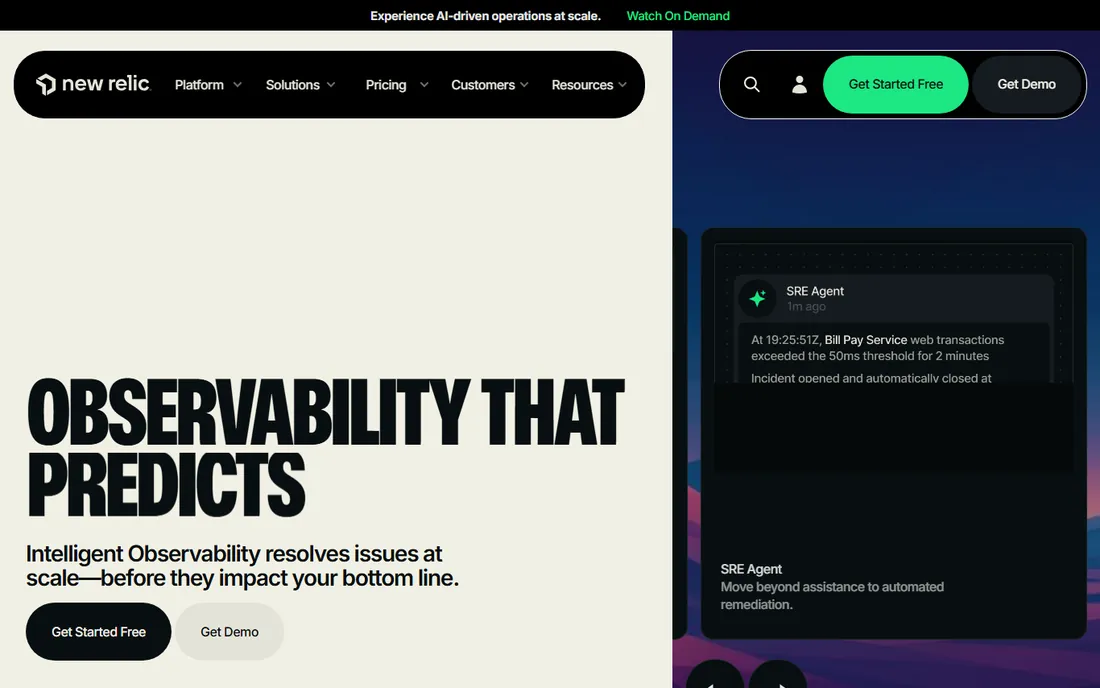
New Relic's pitch is simple: one platform, usage-based pricing, and a free tier that is actually usable. Database monitoring covers PostgreSQL, MySQL, SQL Server and Redis with slow query traces, query response distributions and infrastructure correlation. Because billing is per gigabyte ingested rather than per host, a shop with many small databases can pay less than on per-host tools. The free tier includes 100 GB of monthly ingest and one full platform user at no cost.
That free tier makes New Relic the cheapest way to try serious database observability, and small teams can run on it indefinitely. The catch is the meter. Databases generate a lot of telemetry, and verbose logging can eat the free 100 GB fast, after which overage is $0.35 per GB on Standard. Full platform users beyond the first are paid seats, so the bill has two axes to watch.
What we like- 100 GB of monthly ingest free forever with a full user included
- Bills on data volume, not host count
- Slow query traces with infrastructure context
Watch out for- Costs scale with log volume, which noisy databases inflate
- Advanced features need paid user seats
#5
Quest Foglight
Best for: Oracle and SQL Server shops needing deep wait analysis
Visit quest.com
Starting priceSee website
Free planFree trial (30 days)

Quest Foglight is the heavyweight for Oracle and SQL Server performance forensics. Its standout is SQL PI, the Performance Investigator, which slices wait states across time, SQL text, users and programs so you can see exactly which query burned the last hour and why. It monitors Oracle, SQL Server, PostgreSQL, MySQL and Azure SQL from one console, with long-term trending for capacity planning. The 30-day trial is the full enterprise evaluation, not a crippled demo.
The weakness is the buying experience. There is no public price; everything goes through a quote, and third-party estimates put it around $1,500 per database instance. That is fine for an enterprise renewing Quest's database tooling, but it is slow for a small team that wants a number today.
What we like- SQL Performance Investigator gives deep multidimensional wait-state analysis
- Covers Oracle, SQL Server, PostgreSQL, MySQL and Azure SQL
- 30-day full evaluation
Watch out for- Quote-based pricing with no public numbers
- Enterprise sales process slows small teams
Starting price$149/month (Production, 1 server)
Free planFree trial (14 days)
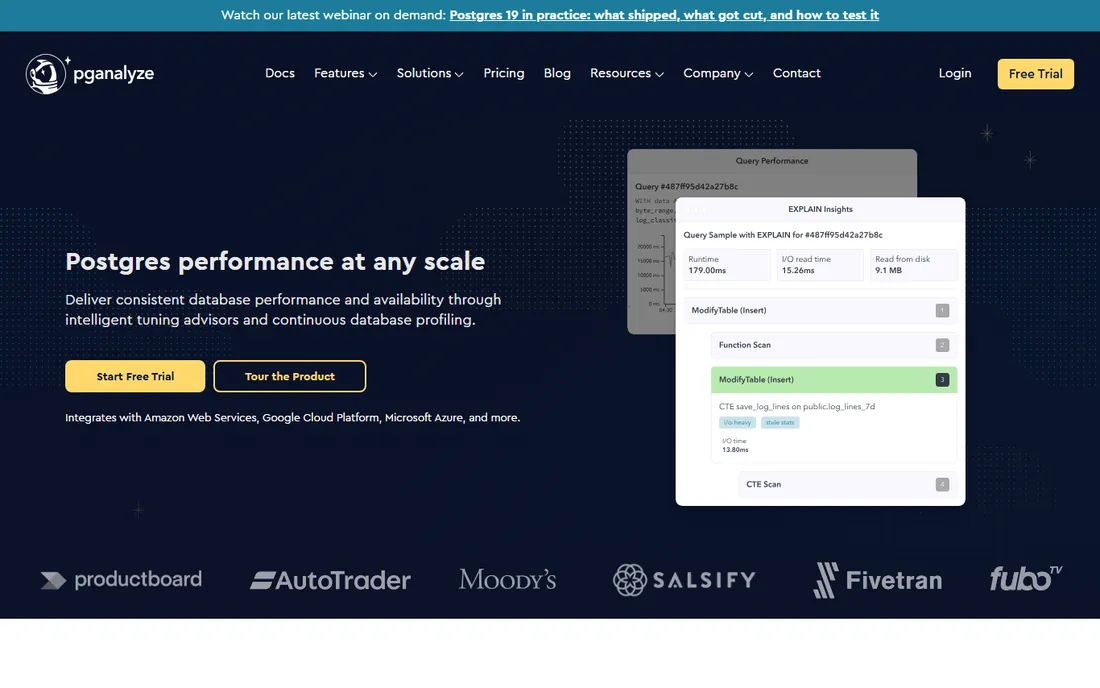
pgAnalyze does one thing: make PostgreSQL faster. It collects per-query statistics, EXPLAIN plans and logs, then tells you what to change. The Index Advisor tests hundreds of index combinations and surfaces the ones that matter; the VACUUM Advisor tunes autovacuum per table to fight bloat. Log Insights structures your Postgres logs with PII filtering, so developers can see slow queries without seeing customer data.
The vendor pricing page is public: $149 per month for Production covering one database server, $399 per month for Scale covering up to four. The 14-day trial is enough to get the Index Advisor's first recommendations. The honest limit is scope. If you run only Postgres, that focus is a strength. If you also run MySQL or SQL Server, you will need a second tool.
What we like- Index Advisor and VACUUM Advisor give actionable tuning recommendations
- Automatic EXPLAIN plan collection
- PII filtering built into log insights
Watch out for- PostgreSQL only, so mixed estates need another tool
- Per-server pricing adds up past a handful of databases
#7
Percona Monitoring and Management
Best for: Open-source shops with MySQL, Postgres or MongoDB
Visit percona.com
Starting priceFree (open source)
Free planYes
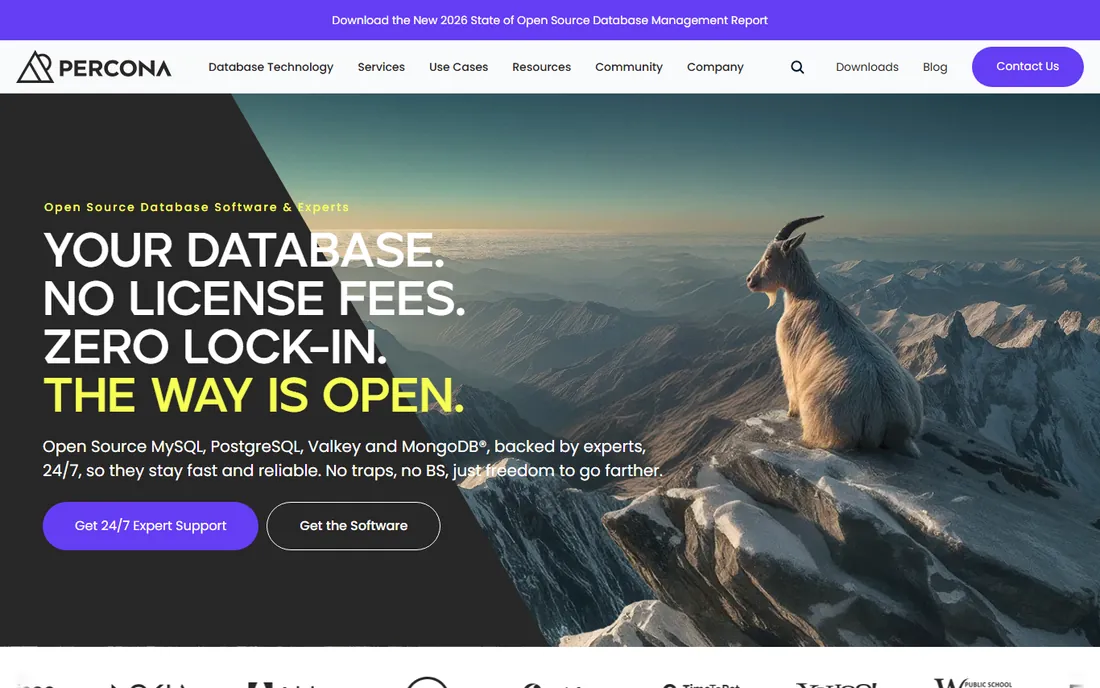
Percona Monitoring and Management, PMM, is the answer for teams that refuse to pay per database. It is fully open source and free: install the server, point the agents at your MySQL, PostgreSQL, MongoDB or MariaDB instances, and you get query analytics, dashboards, alerting and backup management. Percona makes money on support contracts, not on the software, so the monitoring itself has no meter, no seat limit and no feature gates.
The tradeoff is operational. You run PMM yourself: sizing the server, keeping it updated and tuning retention. The dashboards are built on Grafana and VictoriaMetrics, solid but less polished than Datadog or New Relic, and setting up paging-quality alerting takes more work. For a team already running open-source databases, the fit is natural: free software to watch free databases, with the option to buy Percona support when something breaks at 2 AM.
What we like- Completely free and open source
- Covers MySQL, PostgreSQL, MongoDB and ProxySQL
- Query analytics with EXPLAIN built in
Watch out for- You host and maintain it yourself
- Interface and alerting lag commercial polish
#8
ManageEngine Applications Manager
Best for: Budget-conscious IT teams monitoring everything
Visit manageengine.com
Starting priceFrom $395/year (Professional)
Free planYes (up to 5 monitors)
ManageEngine Applications Manager is the budget play: one product that watches databases, application servers, VMs and cloud services, starting at $395 per year for the Professional edition with 10 monitors. Database monitoring covers the common engines with availability, performance and capacity metrics. There is a genuinely free tier for up to 5 monitors and a 30-day trial of everything, plus perpetual licensing for teams that dislike subscriptions.
The catch is depth. Applications Manager tells you a database is slow and shows the top queries, but it does not do the forensic wait-state analysis of Foglight or the automated tuning advice of pgAnalyze. For a small IT team that needs one tool for everything and has $395, that is the right tradeoff. Buy it for breadth on a budget, not for depth.
What we like- Very low entry price for database plus app and server monitoring
- Free tier covers 5 monitors
- Perpetual licenses available
Watch out for- Database depth is shallower than specialist tools
- The interface shows its age
Starting priceFrom $0.08/host/hour
Free planFree trial (15 days)
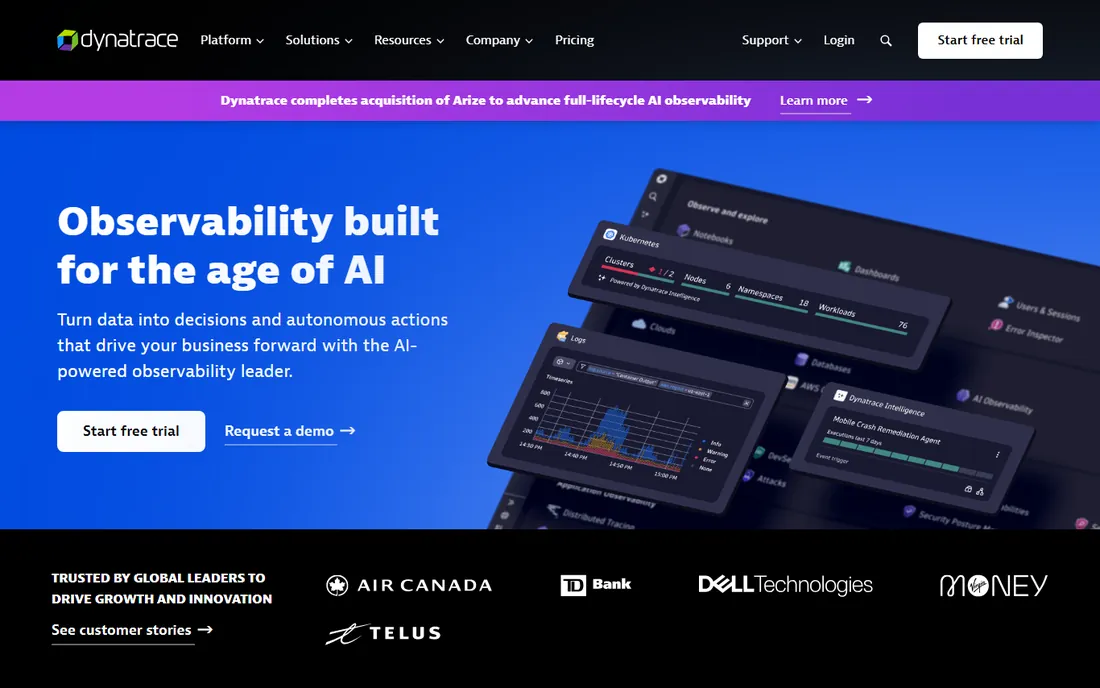
Dynatrace approaches database maintenance from the top down: instead of starting with the database, it starts with the transaction and works backward to the slow query. Its Davis AI correlates database waits with application traces, infrastructure events and deployments, then names the root cause. Database observability covers PostgreSQL, MySQL, Oracle, DB2 and SAP HANA, with the compliance and scale features large enterprises require.
Pricing is consumption-based at about $0.08 per host hour, roughly $58 a month per host, with a 15-day trial that includes trial credit units. The honest warning is predictability: consumption meters are flexible but make annual budgeting an exercise in forecasting. If your company already runs Dynatrace for APM, adding database observability is obvious. If you just need to watch six Postgres servers, it is far more than you need.
What we like- Davis AI automates root-cause detection across the stack
- Database observability tied to full transaction traces
- Strong enterprise compliance story
Watch out for- Pricing is consumption-based and hard to predict
- Overkill for small database estates
What to look for before you buy
Match the tool to your engines
Every tool on this list supports a different set of databases, and the marketing pages all claim more than the fine print delivers. List the engines you actually run, including versions, then check support explicitly. PostgreSQL-only shops get the most from pgAnalyze or PMM. Mixed SQL Server and Oracle estates belong with DPA, Redgate Monitor or Foglight. If your databases live inside Datadog or Dynatrace already, the native add-on usually beats a separate tool.
Understand the meter before the demo
These tools bill in four different ways: per database instance, per server, per host, or per gigabyte ingested. Count your billable units first, then price the tool. A per-host tool is cheap for ten big databases and expensive for a hundred small ones. A per-GB tool is cheap for quiet databases and expensive for chatty ones. Ask for the definition of each unit in writing; Azure SQL databases, read replicas and containers all count differently depending on the vendor.
Trial it on your worst server
Do not trial monitoring software on a quiet dev database. Point the trial at the production server that pages you most, and give it the full trial period. You will learn more in two weeks of real load than in two months of synthetic tests. Check three things: whether the alerts are actionable or noise, whether the query analysis names a fix you can actually apply, and how much overhead the agent adds to the database itself.
How we chose
We compared tools that monitor, diagnose and maintain production databases, focusing on query performance analysis, alerting, supported engines and pricing transparency. We read each vendor's pricing page and documentation, checked supported database versions, and cross-referenced claims against public reviews on G2, Capterra and TrustRadius plus practitioner discussions on Reddit. No hands-on testing was performed. We favored tools with public pricing and real trials, and we included one open-source option because budget is a legitimate selection criterion.
Most teams use about a third of their monitoring tool. Turn on the tuning advisors, not just the dashboards: pgAnalyze's Index Advisor, DPA's tuning advisors and Foglight's SQL PI are the features that pay for the license. Set up anomaly detection on query response time rather than static thresholds, which either page you constantly or never. Review the top ten queries by total time every month, not just the slowest individual queries; a medium-slow query that runs a million times usually costs more than one spectacular failure. Finally, give developers read access. The fastest database fixes happen when the person who wrote the query can see its execution plan.
Frequently asked questions
Do I still need a DBA if I buy one of these tools?
For small estates, often not a full-time one. These tools automate the detection and much of the diagnosis, and a developer with database experience can act on their recommendations. Large or regulated estates still need DBA judgment for schema changes, capacity planning and incident response; the tool makes that person faster, not redundant.
How much overhead do monitoring agents add?
Well-designed agents add 1 to 3 percent overhead, mostly from collecting query statistics the database already tracks. The riskier overhead is from verbose logging and frequent polling, which you control in the settings. Trial the tool on production and compare query response times with the agent on and off before you commit.
Can these tools fix problems automatically?
Mostly no, and you should be careful with the ones that try. Advisors recommend indexes, configuration changes and query rewrites, but applying them is still your call. Automatic index creation exists in some platforms, but blind automation has caused more outages than it has prevented. Use the recommendations, test them, then apply them yourself.
Which tool is best for PostgreSQL specifically?
pgAnalyze, because it is built only for Postgres and its advisors understand Postgres internals like autovacuum and bloat. Percona PMM is the free alternative with solid Postgres query analytics. Datadog and New Relic cover Postgres well if you already use them for the rest of your stack.
What is the difference between monitoring and observability here?
Monitoring tells you when a threshold breaks. Observability lets you ask why, by correlating queries, traces, logs and infrastructure in one place. The newer tools on this list (Datadog, New Relic, Dynatrace) sell observability. The classic tools (DPA, Foglight, Redgate Monitor) sell deep monitoring. For 2 AM pages, you want both: an alert that fires and the context to fix it.
Sources we checked (5)
- https://www.solarwinds.com/database-performance-analyzer
- https://red-gate.com/products/dba/sql-monitor/
- https://www.datadoghq.com/pricing/
- https://pganalyze.com/pricing
- https://download.manageengine.com/sites/meweb/images/applications_manager/apm-datasheet.pdf
Is your product missing or out of date?
We review this list regularly. Vendors can request a listing, send updated pricing or ask about featured placement.

Shihab Mia · Founder, Rankite
Shihab has spent more than a decade helping SaaS and e-commerce brands grow through search. He writes Rankite's software buying guides from pricing pages, documentation and public user reviews. More about Shihab.