How we make this list: we compare pricing pages, product documentation and public user reviews. Ratings come from G2, Capterra or Trustpilot, with the date we checked them.
Key takeaways
- Nagios Core is free, while Nagios XI costs $599 to $4,499 or more per year by subscription, with perpetual licenses from $1,995 to $14,995 or more.
- Icinga, forked from Nagios Core, is the direct migration path, keeping plugin compatibility with a modern interface and API.
- Zabbix and Prometheus are the leading free open-source alternatives, with Zabbix suiting enterprise all-in-one monitoring and Prometheus suiting Kubernetes metrics.
- Datadog from $15 per host per month and PRTG from $2,149 per year suit teams wanting managed or sensor-based monitoring without open-source operations.
- Nagios buyers choose it for cost-sensitive on-premises deployments, while cloud-native teams prefer unified observability platforms.
Quick comparison
| Tool | Best for | Starting price | Free plan |
|---|
 Icinga | Direct Nagios migration | Free | Yes |
 Zabbix | Enterprise all-in-one monitoring | Free | Yes |
 Prometheus | Kubernetes and cloud-native metrics | Free | Yes |
 Datadog | Unified cloud observability | $15 per host per month | No |
 PRTG | Sensor-based Windows and IT monitoring | $2,149 per year | Yes |
 Site24x7 | Mid-market all-in-one monitoring | $9 per month | No |
 Better Stack | Uptime, synthetic, and incident monitoring | $25 per month | No |
 Checkmk | Auto-discovery and automation | See website | No |
Is your product missing or out of date?
We review this list regularly. Vendors can request a listing, send updated pricing or ask about featured placement.
The best Nagios alternatives
Starting priceFree
Free planYes
Icinga is an open-source monitoring platform forked from Nagios Core, offering similar functionality with a more modern architecture and interface. Many buyers evaluate Icinga as a direct Nagios alternative, and migration is the easiest here because existing Nagios plugins and checks carry over.
The modern API and interface fix Nagios's most cited weaknesses: configuration reloads and dated dashboards. Teams keep their check logic while gaining a platform built for current operations.
Free software still carries ownership costs: third-party support runs $5,000 to $20,000 or more per year, and implementation services add $5,000 to $50,000 or more. Pick Icinga when migrating from Nagios with minimal rework. Pick Zabbix when a fresh enterprise platform leads.
What we like- Forked from Nagios Core
- Full plugin compatibility
- Modern architecture and interface
Watch out for- Optional third-party support $5,000 to $20,000+ per year
- Implementation services add cost
- Smaller ecosystem than Zabbix
#2Zabbix
Best for: Enterprise all-in-one monitoring4.3/5 on
G2 (209 reviews, checked Oct 2026)
Visit zabbix.com
Starting priceFree
Free planYes
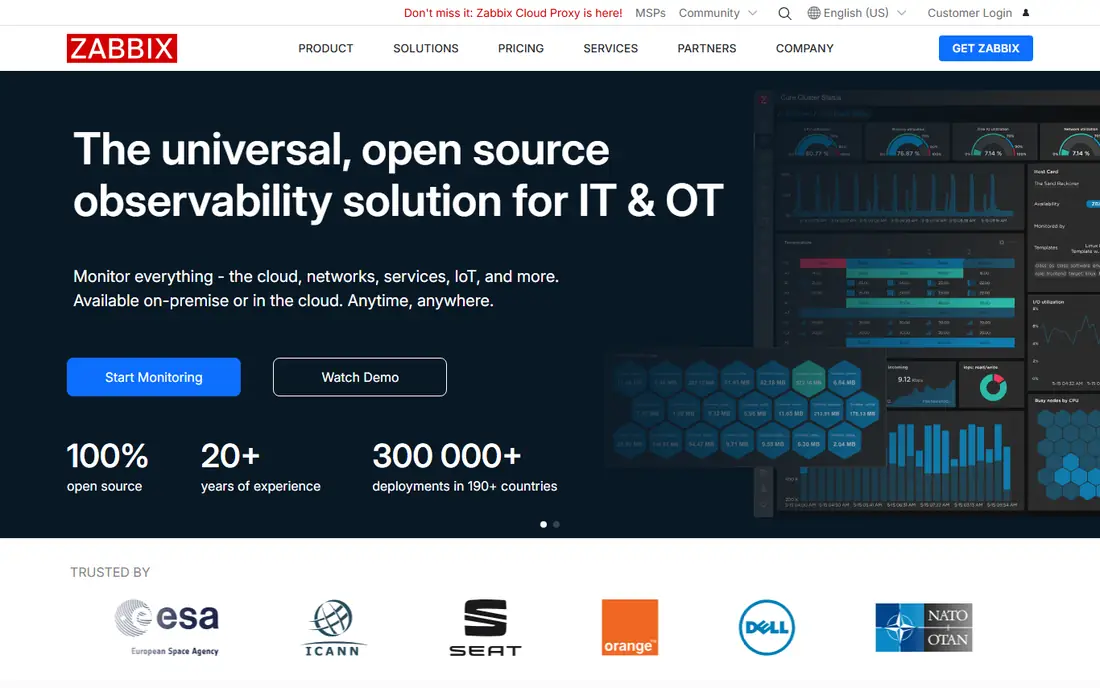
Zabbix is the enterprise all-in-one open-source monitoring choice, with built-in distributed monitoring, customizable dashboards, and AI correlation in newer versions. Users switch to Zabbix to eliminate Nagios XI licensing costs while gaining a more user-friendly interface for navigation and setup.
Proxies distribute monitoring across sites, which scales to thousands of nodes without the distributed-load workarounds Nagios needs. That scalability suits enterprises with many locations and mixed infrastructure.
Self-hosting is free, but the cost of ownership can be expensive once staff time, support, and infrastructure are counted, and Zabbix Cloud starts from $50 per month. Pick Zabbix when enterprise all-in-one monitoring leads. Pick Prometheus when Kubernetes metrics lead.
What we like- Free self-hosted
- Built-in distributed monitoring
- AI correlation in newer versions
- Customizable dashboards
Watch out for- Cost of ownership can be expensive
- Cloud from $50 per month
- Setup complexity at scale
Starting priceFree
Free planYes
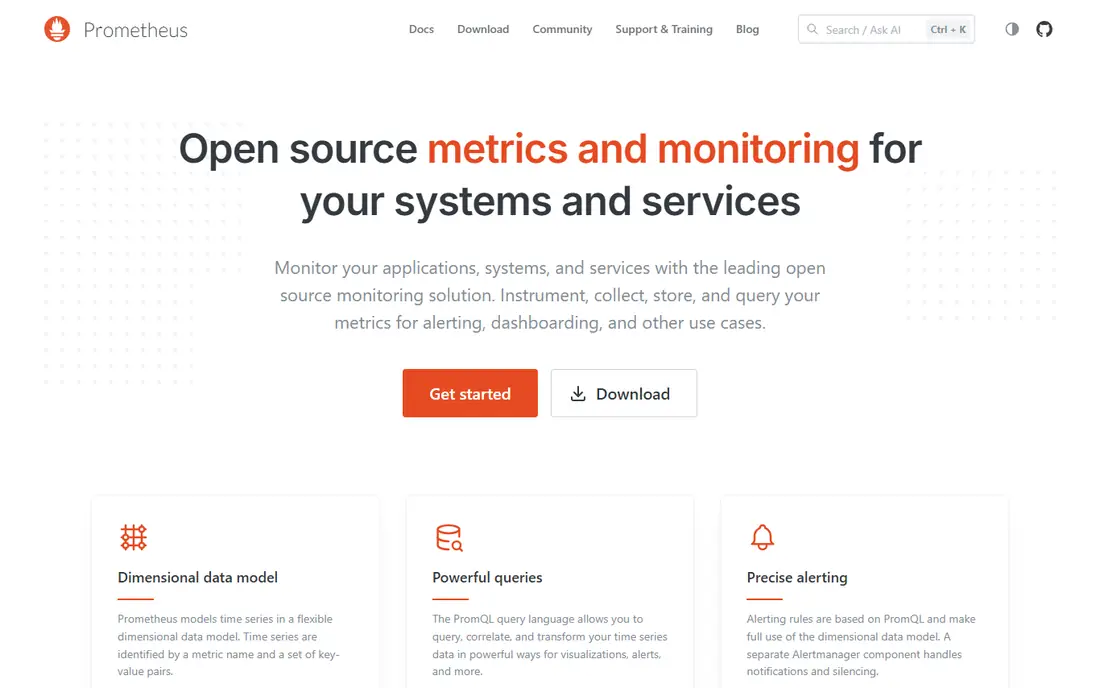
Prometheus is the open-source metrics standard for Kubernetes and cloud-native environments, pulling metrics via exporters and enabling multidimensional queries such as rate calculations over time windows. Service discovery for dynamic targets suits containers that appear and disappear, where Nagios's static configuration lags.
The pull model and exporter ecosystem cover servers, applications, and Kubernetes natively, and pairing with Grafana gives dashboards that rival commercial tools. For cloud-native teams, Prometheus plus Grafana is the default observability stack.
Prometheus covers metrics only, so logs and traces need additional tools, and ownership costs include operations effort. Pick Prometheus when Kubernetes metrics lead. Pick Zabbix when all-in-one monitoring leads.
What we like- Free open source
- Pull-based metrics with service discovery
- Multidimensional queries
- Kubernetes native
Watch out for- Metrics only, no logs or traces alone
- Cost of ownership can be expensive
- Needs Grafana for dashboards
#4Datadog
Best for: Unified cloud observability4.4/5 on
G2 (726 reviews, checked Oct 2026)
Visit datadoghq.com
Starting price$15 per host per month
Free planNo
Datadog offers unified cloud observability across infrastructure monitoring, log management, real user monitoring, and application performance, starting at $15 per host per month for infrastructure. That breadth replaces several point tools, which suits cloud-native teams wanting one platform.
Integrations cover every major cloud and application stack, and the platform correlates metrics, logs, and traces into single investigations. For distributed systems, that correlation cuts mean time to resolution compared with siloed tools.
Costs climb with data ingestion and additional products, and the pricing model takes effort to forecast. Pick Datadog when unified cloud observability leads. Pick Prometheus when free open-source metrics lead.
What we like- Infrastructure, logs, APM, and synthetics in one platform
- Cloud-native breadth
- Strong integrations
Watch out for- $15 per host per month infrastructure baseline
- Costs climb with ingestion
- Data-based pricing complexity
#5PRTG
Best for: Sensor-based Windows and IT monitoring4.7/5 on
G2 (214 reviews, checked Oct 2026)
Visit paessler.com
Starting price$2,149 per year
Free planYes
PRTG is favored as an all-in-one monitoring solution that simplifies setup and management, with flexible pricing tiers based on sensor counts. The free tier covers up to 100 sensors, which suits small networks, while paid plans start from $2,149 per year.
Sensor-based monitoring lets teams monitor exactly what they need, from bandwidth to server health, in one console with dashboards and alerts. Windows and IT teams find the learning curve gentler than Nagios's configuration files.
Sensor counting gets complex at scale, and cloud-native depth trails Datadog and Prometheus. Pick PRTG when sensor-based simplicity leads. Pick Zabbix when open-source enterprise monitoring leads.
What we like- Free up to 100 sensors
- Sensor-based simplicity
- All-in-one monitoring for on-prem networks
Watch out for- From $2,149 per year beyond free tier
- Sensor counting complexity
- Less cloud-native depth
#6Site24x7
Best for: Mid-market all-in-one monitoring4.6/5 on
G2 (477 reviews, checked Oct 2026)
Visit site24x7.com
Starting price$9 per month
Free planNo
Site24x7 suits mid-market IT teams with all-in-one monitoring across websites, servers, synthetics, and real user monitoring, starting from $9 per month for website monitoring. That breadth at a low entry price makes it accessible for teams that cannot justify Datadog.
Server and synthetic monitoring add depth beyond website checks, and the platform covers multi-cloud environments. For a mid-market team, Site24x7 balances breadth and price better than enterprise platforms.
The $9 website tier is extremely limited, and full breadth needs higher tiers. Pick Site24x7 when mid-market all-in-one value leads. Pick Datadog when enterprise observability depth leads.
What we like- Website, server, synthetic, and real user monitoring
- From $9 per month
- Mid-market fit
Watch out for- Website tier extremely limited at $9
- Higher tiers needed for full breadth
- Less depth than Datadog
#7Better Stack
Best for: Uptime, synthetic, and incident monitoring4.8/5 on
G2 (344 reviews, checked Oct 2026)
Visit betterstack.com
Starting price$25 per month
Free planNo
Better Stack covers synthetic monitoring, uptime monitoring, API monitoring, log management, and incident management, starting at $25 per month for 50 monitors. It suits teams whose main need is knowing when services go down and managing the incident response, rather than deep infrastructure metrics.
The incident management integration ties alerts to on-call workflows, which shortens response time. For web-focused teams, uptime and API monitoring matter more than host-level metrics, and Better Stack prices that job fairly.
Infrastructure depth trails Zabbix and Datadog, and per-monitor pricing adds up at large scale. Pick Better Stack when uptime and incident management lead. Pick Zabbix when infrastructure depth leads.
What we like- Starts at $25 per month for 50 monitors
- Synthetic, uptime, API, and log monitoring
- Incident management
Watch out for- Less infrastructure depth than Zabbix
- Smaller platform than Datadog
- Per-monitor pricing at scale
#8Checkmk
Best for: Auto-discovery and automation4.7/5 on
G2 (306 reviews, checked Oct 2026)
Visit checkmk.com
Starting priceSee website
Free planNo
Checkmk suits teams wanting automation, with auto-discovery that cuts setup time sharply and an efficient core for large environments. Its Nagios-compatible heritage eases migration, while auto-discovery and templates bring consistency that manual Nagios configuration lacks.
The automation focus suits dynamic environments where hosts change frequently: discovery finds new systems and applies templates automatically, rather than requiring manual config edits. That efficiency is why Checkmk appears among top Nagios alternatives for automation-focused buyers.
Pricing is quote-based, and the community is smaller than Zabbix's. A pilot on one site or one host group reveals whether auto-discovery rules match the environment before committing the whole estate, since discovery templates that fit a homogeneous data center may misfire in a mixed office and factory network. Pick Checkmk when auto-discovery and automation lead. Pick Icinga when direct Nagios migration leads.
What we like- Auto-discovery cuts setup time
- Efficient core
- Automation-friendly
- Nagios-compatible heritage
Watch out for- Quote-based pricing
- Smaller community than Zabbix
- Enterprise features need higher tiers
How we chose
We compared tools that replace Nagios's core job, infrastructure and network monitoring, using vendor pages and 2026 comparison data. We favored published prices and marked quote-based tools as such, since several monitoring platforms hide pricing behind sales conversations. We also split open-source from managed options, since ownership cost decides the real comparison for free tools.
Free software is not free operations
Open-source monitoring tools are free to download, but the cost of ownership can be expensive once staff time, infrastructure, support, and implementation are counted. Nagios XI at $10,000 to $18,000 for 300 nodes including maintenance compares with Icinga at $5,000 to $15,000 primarily in support and services, so the gap is narrower than license prices suggest.
That ownership math should drive the choice. A team with monitoring expertise and on-premises infrastructure gains from free tools, since the labor already exists. A team without that expertise pays more in managed pricing but avoids the staffing cost of running open-source monitoring well. Alert fatigue belongs in the same calculation: a tool that fires hundreds of low-value alerts trains the team to ignore them, which defeats the purpose of monitoring entirely. Choose the tool whose alert quality the on-call team trusts, not just the one with the lowest license price.
Hybrid monitoring combines infrastructure tools with observability platforms for full visibility: Nagios or Zabbix for infrastructure, Prometheus for metrics, and traces via OpenTelemetry for application depth. Start with auto-discovery to cut setup time, use templates for consistency, and test in staging before migrating production monitoring.
Frequently asked questions
How much does Nagios XI cost?
Nagios XI costs $599 to $4,499 or more per year by subscription based on nodes, or $1,995 to $14,995 or more as a perpetual license. Annual maintenance runs 20 to 25 percent of the license fee for perpetual purchases, and is included in subscriptions.
What is the best free Nagios alternative?
Zabbix and Prometheus lead among free options, with Zabbix suiting enterprise all-in-one monitoring and Prometheus suiting Kubernetes metrics. Icinga is the best free choice for direct Nagios migration, keeping plugin compatibility.
Is Icinga compatible with Nagios plugins?
Yes, Icinga forked from Nagios Core and retains plugin compatibility, which makes migration easier than moving to Zabbix or Prometheus. Map existing checks and plugins to Icinga first, then add modern APIs and service discovery.
Which alternative is best for Kubernetes?
Prometheus leads for Kubernetes, with service discovery for dynamic targets and multidimensional queries. Pair it with Grafana for dashboards and OpenTelemetry for traces alongside metrics.
Which alternative is easiest to set up?
PRTG and Checkmk offer auto-discovery, which cuts setup time compared with Nagios's manual configuration. PRTG's sensor model suits Windows and IT teams, while Checkmk's automation suits dynamic environments.
Should I choose open-source or managed monitoring?
Choose open-source when the team has monitoring expertise and on-premises infrastructure, since labor already exists. Choose managed when ease of use and unified observability matter more, accepting higher subscription costs in exchange for less operations burden.
Sources we checked (6)
- https://betterstack.com/community/comparisons/nagios-alternative/
- https://www.vendr.com/marketplace/nagios
- https://thectoclub.com/tools/best-open-source-network-monitoring-tools/
- https://thectoclub.com/tools/best-nagios-alternative/
- https://copyprogramming.com/howto/nagios-alternatives
- https://middleware.io/blog/infrastructure-monitoring-tools/
Is your product missing or out of date?
We review this list regularly. Vendors can request a listing, send updated pricing or ask about featured placement.

Shihab Mia · Founder, Rankite
Shihab has 5+ years in B2B and SaaS SEO. He writes Rankite's software buying guides from pricing pages, documentation and public user reviews. More about Shihab.