How we make this list: we compare pricing pages, product documentation and public user reviews. Ratings come from G2, Capterra or Trustpilot, with the date we checked them.
Key takeaways
- The LGTM stack, Loki for logs, Grafana for dashboards, Tempo for traces, and Mimir for metrics, is Grafana Labs' open-source observability stack.
- Teams leave LGTM when they want a managed service with less operational work, unified billing, or deeper APM features like profiling and real user monitoring.
- Datadog and New Relic are the leading managed alternatives, with full-stack coverage and mature APM, at per-host or per-GB pricing that scales with usage.
- SigNoz and VictoriaMetrics keep the open-source model with a simpler single-binary or single-stack design, while Prometheus with Jaeger suits teams that want full control.
- The deciding factors are operational burden, pricing model, APM depth, log and trace volume, and whether your team wants to run infrastructure or buy a service.
Quick comparison
Is your product missing or out of date?
We review this list regularly. Vendors can request a listing, send updated pricing or ask about featured placement.
The best LGTM stack alternatives

#1Datadog
Best for: Full-stack managed observability4.4/5 on
G2 (726 reviews, checked Oct 2026)
Visit datadog.com
Starting price$15/host/month
Free planNo
Datadog is the leading managed alternative to LGTM, covering metrics, logs, traces, real user monitoring, synthetics, and security in one platform with a huge integration library. Teams that leave LGTM to escape operational burden get a service that just works: agents, dashboards, and alerts without running Loki, Tempo, and Mimir clusters. APM depth exceeds LGTM's, with profiling, continuous profiler, and database monitoring included.
Pricing starts at $15 per host per month for infrastructure and $31 for APM, with logs and traces billed per GB, and bills add up fast at scale. Log costs need active management through indexes and exclusion filters. For a team that wants full-stack managed observability and can manage usage-based billing, Datadog is the best pick.
What we like- Broadest managed coverage: metrics, logs, traces, RUM, synthetics
- Mature APM
- Huge integration library
Watch out for- Per-host and per-GB pricing adds up fast
- Bill surprises are common
- Log costs need active management

#2New Relic
Best for: Usage-based managed observability4.4/5 on
G2 (586 reviews, checked Oct 2026)
Visit newrelic.com
Starting priceFree; Paid $49/month
Free planYes
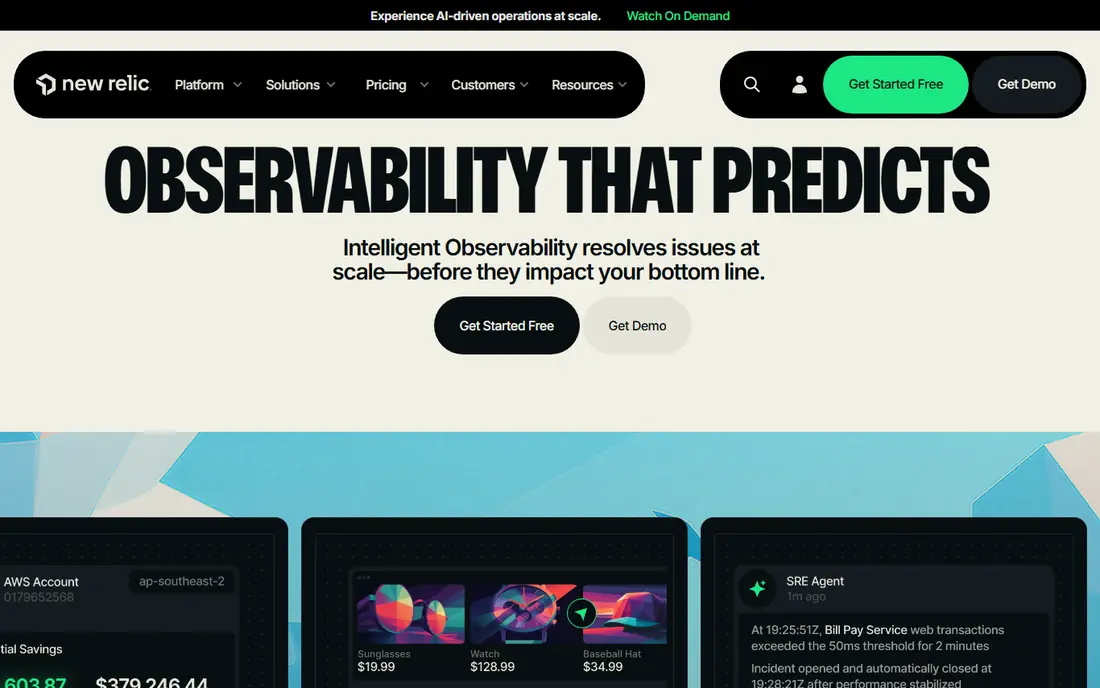
New Relic is the usage-based managed alternative, with 100 GB of free data ingest per month and pricing based on data and users rather than per-host fees. That model suits teams with many small hosts or containers, where Datadog's per-host pricing penalizes density. APM is strong, dashboards are flexible, and the free tier covers small projects entirely.
Costs scale with data volume, so high-cardinality metrics and verbose logs still need control, and some features require higher tiers. For a team that wants managed observability with a generous free tier and no per-host penalty, New Relic is the best value.
What we like- 100 GB of free data ingest monthly
- Usage-based pricing without per-host fees
- Strong APM and dashboards
Watch out for- Costs scale with data volume
- Some features need higher tiers
- Log management takes tuning

#3Dynatrace
Best for: Enterprise APM depth4.5/5 on
G2 (1,371 reviews, checked Oct 2026)
Visit dynatrace.com
Starting priceSee website
Free planNo
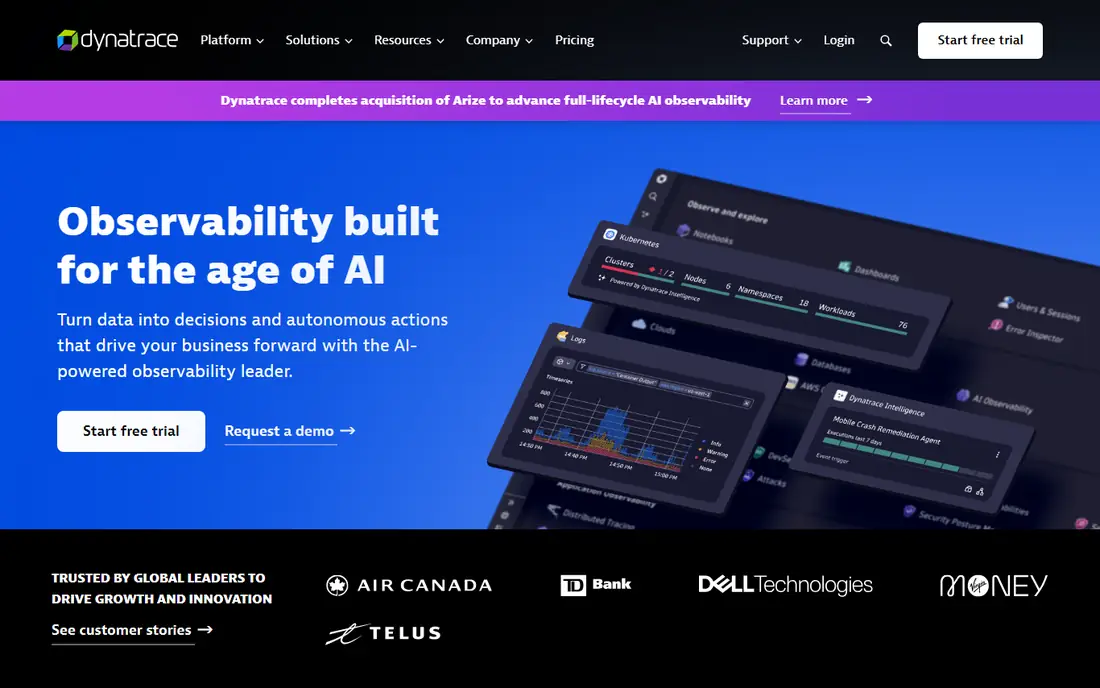
Dynatrace is the enterprise APM alternative, with automatic instrumentation, AI-driven root cause analysis, and dependency mapping that few platforms match. Its OneAgent auto-discovers services and maps topology without manual configuration, and its Davis AI correlates anomalies to probable causes. Large enterprises with complex, regulated environments get the deepest observability available.
Pricing is enterprise and quote-based, the platform is complex to administer, and it is overkill for small teams or simple stacks. For a large organization that needs the deepest APM and can fund it, Dynatrace is the most capable choice.
What we like- Deepest automatic APM with AI causation
- Automatic topology and dependency mapping
- Strong enterprise support
Watch out for- Enterprise pricing
- Complex platform
- Overkill for small teams
#4Splunk Observability
Best for: Enterprise log and APM4.3/5 on
G2 (55 reviews, checked Oct 2026)
Visit splunk.com
Starting price$15/host/month
Free planNo
Splunk Observability suits enterprises already using Splunk for log management, extending that investment into APM, infrastructure monitoring, and real user monitoring. Its log search heritage gives powerful query capabilities, and APM tiers at $15, $60, and $75 per host per month let teams choose depth. Splunk shops get unified tooling and procurement.
Pricing is complex across tiers and data volume, log costs scale with ingest, and the broad platform takes learning. For an enterprise already standardized on Splunk, Observability is the natural extension.
What we like- Strong log search and analytics heritage
- APM with $15, $60, and $75 host tiers
- Good for Splunk shops
Watch out for- Pricing is complex
- Log costs scale with volume
- Platform is broad and takes learning

#5
Elastic Observability
Best for: Open search-based observability
Visit elastic.co
Starting price$95/month
Free planNo
Elastic Observability is the search-based open alternative, built on Elasticsearch with APM agents, log ingestion, uptime monitoring, and machine learning anomaly detection. Teams that already use Elasticsearch for search get observability on the same platform, and the managed Elastic Cloud option removes cluster operations. Log search power is unmatched for ad hoc investigation.
Self-hosting Elasticsearch takes real expertise, cloud pricing starts at $95 a month, and tuning is needed at scale for index management and retention. For a team with Elasticsearch experience that wants powerful log search plus APM, Elastic is a strong choice.
What we like- Open search foundation with powerful log search
- APM and uptime included
- Self-host or managed cloud
Watch out for- Self-hosting Elasticsearch takes expertise
- Cloud pricing from $95 a month
- Tuning needed at scale
Starting priceFree; Cloud $49/month
Free planYes
SigNoz is the open-source Datadog alternative, offering metrics, logs, and traces in a single platform backed by ClickHouse, with a self-hosted free version and a managed cloud from $49 a month. Teams that like LGTM's open model but want a unified product instead of four separate components get one binary, one UI, and one query language family. OpenTelemetry native ingestion simplifies agent setup.
The community is smaller than Grafana's, integrations are fewer than Datadog's, and self-hosting still needs operations work. For a team that wants open-source observability with less assembly than LGTM, SigNoz is the best pick.
What we like- Open source with metrics, logs, and traces in one binary
- ClickHouse backend
- Cloud option from $49 a month
Watch out for- Smaller community than Grafana's
- Fewer integrations than Datadog
- Self-hosting still needs operations
Starting priceFree
Free planYes
VictoriaMetrics is the high-volume metrics alternative, built for efficient storage and querying of massive metric series with high cardinality that strain Prometheus. It is Prometheus compatible, runs as a single binary, and ingests data with lower resource use than most alternatives. Teams with huge metric volumes or tight infrastructure budgets get the best cost per series.
Logs and traces need separate tools like VictoriaLogs and Jaeger, the ecosystem is smaller than Grafana's, and enterprise features like long-term retention management are paid. For a metrics-heavy team that wants efficiency and Prometheus compatibility, VictoriaMetrics is the best choice.
What we like- Very efficient metrics storage
- Handles high cardinality well
- Single binary
- Prometheus compatible
Watch out for- Logs and traces need separate tools
- Smaller ecosystem
- Enterprise features are paid
Starting priceFree
Free planYes
Prometheus plus Jaeger is the full-control self-hosted alternative, combining Prometheus for metrics, Jaeger for distributed tracing, and Grafana for dashboards, with Loki added for logs if needed. Everything is open source and free, the community is huge, and teams keep full control over data, retention, and deployment. It suits platform teams with the skills to run it.
It requires the most operational work of any option here, logs need Loki or another tool, and scaling beyond a single Prometheus needs Thanos or Cortex. For a team with strong platform skills that wants maximum control at zero license cost, Prometheus plus Jaeger is the classic choice.
What we like- Fully open source and free
- Huge community
- Full control over data and retention
Watch out for- Most operational work of any option here
- Logs need Loki or another tool
- Scaling needs Thanos or Cortex
How we chose
We compared observability platforms that replace LGTM's core job: collecting metrics, logs, and traces, visualizing them, and alerting on problems. We weighed coverage across the three pillars, APM depth, operational burden, pricing model, and open-source versus managed trade-offs from vendor pages and 2026 observability comparisons. We left out single-pillar tools without a full stack story and log-only platforms without metrics and traces. Where pricing is quote-based, we say so rather than guessing.
How to pick an LGTM replacement
Start with your operational appetite. Teams that want to stop running infrastructure should shortlist Datadog, New Relic, and Dynatrace. Teams that want open source with less assembly should shortlist SigNoz. Teams with high metric volume should shortlist VictoriaMetrics. Teams with Elasticsearch skills should shortlist Elastic. Teams with strong platform skills should shortlist Prometheus plus Jaeger. Then model your data volume, since log and trace costs dominate managed bills.
Model data volume before choosing a managed vendor
Managed observability bills are driven by data volume: hosts, GB ingested, and custom metrics. Estimate your current LGTM volumes for logs, metrics, and traces, then price each managed candidate at that volume plus growth. A vendor that looks cheap at trial scale can cost multiples more at production scale, especially for verbose logs.
Keep Grafana dashboards if you can
If your team has invested in Grafana dashboards, prefer alternatives that keep Grafana as the visualization layer, such as Prometheus, VictoriaMetrics, or Mimir-compatible backends. Rebuilding dashboards in a new UI is real work, and Grafana's plugin ecosystem is hard to replicate. A migration that preserves dashboards cuts adoption risk sharply.
Plan the migration pillar by pillar
Do not migrate metrics, logs, and traces at once. Start with metrics, validate dashboards and alerts, then move logs, then traces, keeping LGTM running in parallel until each pillar is proven. A pillar-by-pillar migration limits blast radius and gives your team time to learn the new platform without an outage window.
Frequently asked questions
Is Datadog better than the LGTM stack?
For managed convenience and APM depth, yes. For cost control and data ownership, LGTM wins: open source has no per-host or per-GB license cost. The trade is operational work versus service fees, and the right answer depends on your team's skills and data volume.
What is the cheapest LGTM alternative?
Prometheus plus Jaeger is cheapest at zero license cost, followed by VictoriaMetrics and SigNoz self-hosted. Among managed options, New Relic's free tier covers small projects and SigNoz Cloud starts at $49 a month. Remember that self-hosted tools still cost infrastructure and engineer time.
Can I keep Grafana with a new backend?
Yes. Prometheus, VictoriaMetrics, and Mimir-compatible backends all work with Grafana as the dashboard layer. Datadog, New Relic, and Dynatrace use their own UIs, so moving to them means rebuilding dashboards. Factor dashboard migration into your decision.
Do managed tools support OpenTelemetry?
Yes, all major managed vendors now ingest OpenTelemetry data, which makes migration easier: instrument once with OpenTelemetry and switch backends without re-instrumenting applications. Confirm the specific signals and attributes each vendor supports before committing.
How do I control log costs on a managed platform?
Use index and exclusion filters to drop low-value logs, sample verbose traces, set retention by severity, and alert on ingest spikes. Most bill surprises come from a single noisy service, so per-service ingest dashboards and budgets are the first control to set up.
Sources we checked (8)
- https://www.datadog.com
- https://newrelic.com
- https://www.dynatrace.com
- https://www.splunk.com
- https://www.elastic.co
- https://signoz.io
- https://victoriametrics.com
- https://prometheus.io
Is your product missing or out of date?
We review this list regularly. Vendors can request a listing, send updated pricing or ask about featured placement.

Shihab Mia · Founder, Rankite
Shihab has 5+ years in B2B and SaaS SEO. He writes Rankite's software buying guides from pricing pages, documentation and public user reviews. More about Shihab.
 SigNoz
 VictoriaMetrics
 Prometheus plus Jaeger