How we make this list: we compare pricing pages, product documentation and public user reviews. Ratings come from G2, Capterra or Trustpilot, with the date we checked them.

Key takeaways
- PageSpeed Insights is free and shows the CrUX field data Google actually judges, so start every audit there.
- DebugBear ($49 a month) is the best paid monitor, combining lab tests, real-user data, and CrUX trends with alerts.
- GTmetrix ($4.99 a month reported) is the friendliest report to hand a client, with Lighthouse scores and a readable waterfall.
- WebPageTest ($18 a month) gives the deepest technical detail, with filmstrips and waterfalls that show exactly what slows a page.
- Lab data alone is not enough: a tool that only runs Lighthouse cannot tell you whether real visitors pass Google's thresholds.
What are Core Web Vitals, and why do they matter for SEO?
Core Web Vitals are three metrics Google uses to judge page experience: Largest Contentful Paint, which measures how fast the main content loads; Interaction to Next Paint, which measures how quickly a page responds to a tap or click; and Cumulative Layout Shift, which measures how much the page jumps around while loading. Google replaced First Input Delay with Interaction to Next Paint in March 2024, so old reports that still show the old metric are stale.
What is the difference between lab data and field data?
Lab data comes from a simulated test: a tool loads your page in a controlled environment and measures what happens. Field data comes from real visitors, collected by Google through the Chrome User Experience Report, known as CrUX. The difference matters because a page can pass a lab test and still fail in the field, where slow connections, old phones, and third-party scripts drag scores down. Google's published verdict rests on field data, so a lab-only tool answers a different question from the one that decides your ranking.
How often should you check Core Web Vitals?
Check on demand when you change something, and monitor continuously if the site earns money. A one-off check with PageSpeed Insights is enough after a redesign or a plugin change. A site that earns from search should run scheduled monitoring, because a new script, an image change, or a hosting problem can push a metric over the threshold without anyone noticing. DebugBear, SpeedCurve, Calibre, and Dareboost all run scheduled tests and alert you when a metric slips, which is the difference between catching a regression in a day and discovering it in a quarterly audit.
Pick PageSpeed Insights if you only need checks, and DebugBear if you need monitoring. PageSpeed Insights is free, needs no account, and shows lab scores plus CrUX field data for any public URL, which covers most one-off audits. DebugBear at $49 a month adds scheduled Lighthouse tests, real-user monitoring, CrUX trend tracking, and alerts, which is the full picture for a site that earns from search. WebPageTest is the best free alternative for deep diagnosis, with filmstrips and waterfalls that show exactly which resource slows the page.
Comparison table
| Tool | Best for | Starting price | Free plan |
| Google PageSpeed Insights | Free one-off checks with field data | Free | Yes (free) |
| GTmetrix | Readable, shareable performance reports | From $4.99 per month (reported) | Yes (free account) |
| WebPageTest | Deep technical diagnosis with filmstrips | From $18 per month | Yes (free tier) |
| DebugBear | Ongoing Core Web Vitals monitoring with alerts | From $49 per month | Free trial (14 days) |
| SpeedCurve | Synthetic plus real-user monitoring for teams | From $15 per month (reported) | No free plan |
| Calibre | Web performance monitoring with CrUX data | From $75 per month | No free plan |
| Dareboost | Multi-page monitoring with actionable fixes | From $22 per month (reported) | Free trial |
| Treo | Lighthouse-based monitoring with a visual timeline | From $79 per month (reported) | Free trial |
What it costs to monitor Core Web Vitals
Checking is free; monitoring costs $15 to $79 a month for a small site. PageSpeed Insights, the free tiers of GTmetrix and WebPageTest, and Google Search Console's Core Web Vitals report all cost nothing and cover one-off checks. Paid monitoring starts at $15 a month for SpeedCurve synthetic tests and $22 a month reported for Dareboost, with DebugBear at $49 a month as the best value for a single site. Calibre at $75 a month and Treo at $79 a month reported suit teams that monitor many pages.
Quick comparison
| Tool | Best for | Starting price | Free plan |
|---|
 Google PageSpeed Insights | Free one-off checks with the field data Google actually uses | Free | Yes (free) |
 GTmetrix | Readable, shareable reports to hand to a client or a developer | From $4.99 per month (reported) | Yes (free account) |
 WebPageTest | Deep technical diagnosis when a page is slow and you do not know why | From $18 per month | Yes (free tier) |
 DebugBear | Ongoing Core Web Vitals monitoring with lab, real-user, and CrUX data in one place | From $49 per month | Free trial (14 days) |
 SpeedCurve | Performance teams that want synthetic tests plus real-user data tied to business numbers | From $15 per month (reported) | No free plan |
 Calibre | Teams that want RUM, CrUX, and synthetic tests in one monitoring platform | From $75 per month | No free plan |
 Dareboost | Multi-page monitoring with actionable fix suggestions | From $22 per month (reported) | Free trial |
 Treo | Lighthouse-based monitoring with a visual timeline of page loads | From $79 per month (reported) | Free trial |
Is your product missing or out of date?
We review this list regularly. Vendors can request a listing, send updated pricing or ask about featured placement.
#1
Google PageSpeed Insights
Best for: Free one-off checks with the field data Google actually uses
Visit pagespeed.web.dev
Starting priceFree
Free planYes (free)
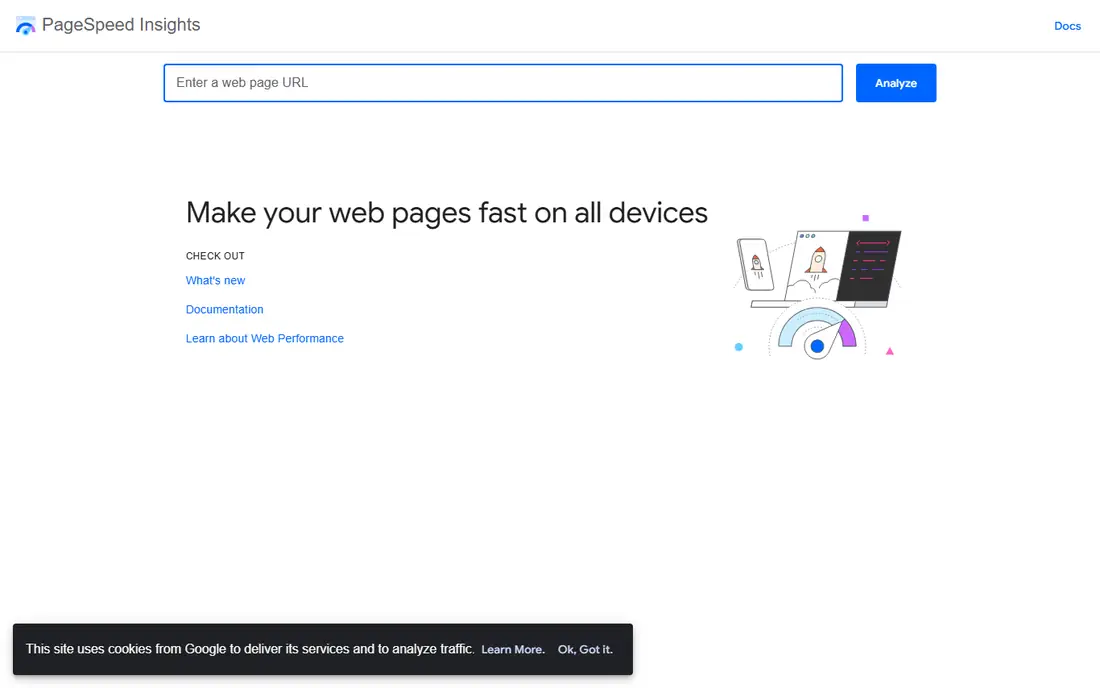
Google PageSpeed Insights is the default check for Core Web Vitals, and it should be the first tool you open. Paste any public URL and it returns a Lighthouse lab score plus the CrUX field data Google publishes for that page, including Largest Contentful Paint, Interaction to Next Paint, and Cumulative Layout Shift for real Chrome visitors. That combination is what makes it authoritative: the field data is the same data behind Google's pass or fail verdict. It is free, needs no account, and works for any site. The limits are real but narrow: it checks one URL at a time, keeps no history, and sends no alerts, so it cannot tell you when a metric slips next month.
What we like- Completely free with no account needed
- Shows CrUX field data alongside lab scores
- The same Lighthouse engine Google uses
- Covers mobile and desktop in one run
Watch out for- One URL at a time with no monitoring or history
- No alerts when a metric slips
- The report can overwhelm beginners with technical detail
#2
GTmetrix
Best for: Readable, shareable reports to hand to a client or a developer
Visit gtmetrix.com
Starting priceFrom $4.99 per month (reported)
Free planYes (free account)
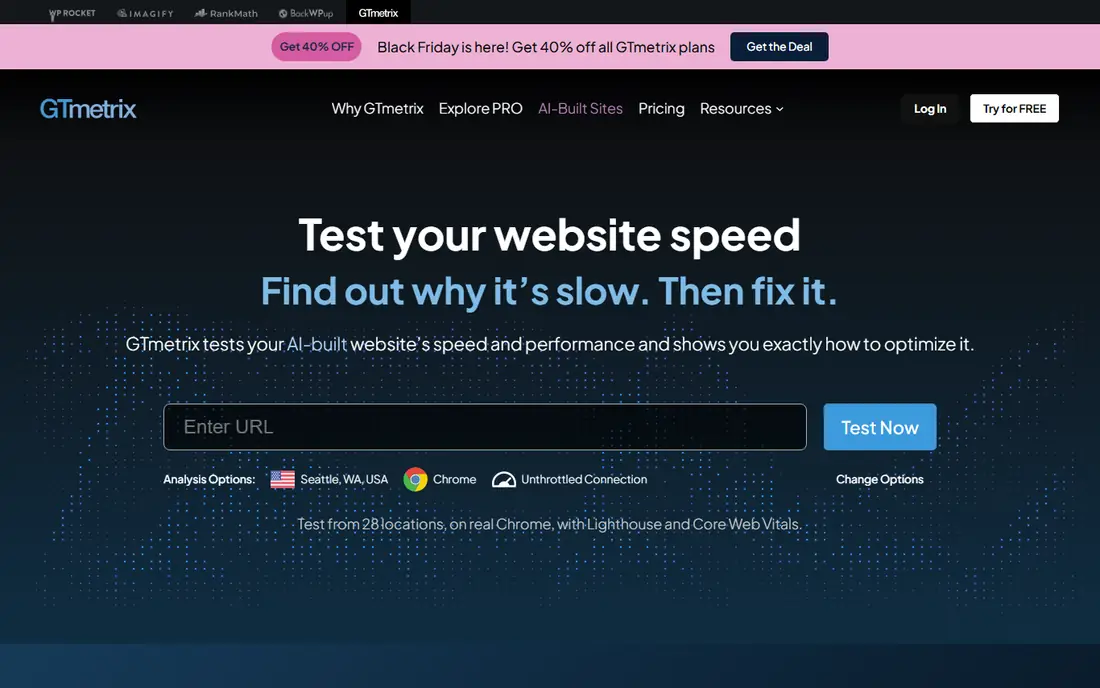
GTmetrix is the friendliest report to hand a client. It runs Lighthouse, adds its own structure score and a letter grade, and lays out a clean waterfall and a video of the load, all behind a link you can send. The free account covers basic testing with limits, while paid PRO plans start from a reported $4.99 a month on annual billing and add monitored slots, more test locations, and history. Its weakness is scope: it does not support real-user monitoring or CrUX field data, so it shows lab performance only. Use it for diagnosis and client reporting, and pair it with PageSpeed Insights for the field verdict.
What we like- The friendliest report in this list, with a letter grade and a clean waterfall
- Runs Lighthouse plus its own structure score
- Video of the page load shows the problem visually
- Monitored slots on paid plans add history
Watch out for- Does not track real-user or CrUX data, so it cannot show the field verdict
- The best features sit behind paid plans
- The free account is limited in tests and history
#3
WebPageTest
Best for: Deep technical diagnosis when a page is slow and you do not know why
Visit webpagetest.org
Starting priceFrom $18 per month
Free planYes (free tier)
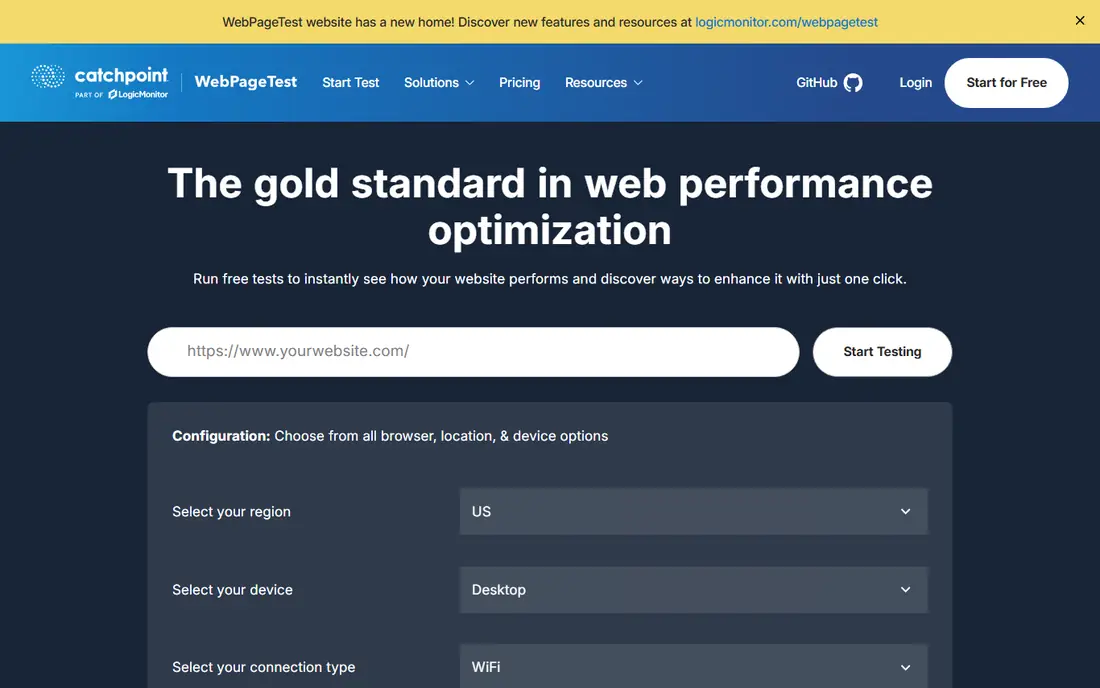
WebPageTest, now owned by Catchpoint, is what to open when a page is slow and you do not know why. Its filmstrip view shows the page loading frame by frame, and its waterfall shows every request, so you can see exactly which script, image, or font blocks rendering. Results include lab data and CrUX metrics, and tests can be configured by location, browser, device, and connection speed. The free tier covers a monthly allowance of runs, while paid plans start at $18 a month and are priced by test volume. It is the most technical tool here, so beginners should start with PageSpeed Insights and graduate to WebPageTest for hard problems.
What we like- The deepest waterfalls and filmstrips in this list
- Results include lab data and CrUX metrics
- Highly configurable tests across locations, browsers, and connection speeds
- Free tier with a monthly run allowance
Watch out for- Steep learning curve for beginners
- The interface assumes technical knowledge
- Paid plans are priced by test runs, so heavy use costs more than a flat subscription
#4
DebugBear
Best for: Ongoing Core Web Vitals monitoring with lab, real-user, and CrUX data in one place
Visit debugbear.com
Starting priceFrom $49 per month
Free planFree trial (14 days)
DebugBear is the monitoring tool to buy first if speed is part of your job. It runs scheduled Lighthouse tests on the pages you choose, tracks CrUX field data next to the lab numbers, and adds real-user monitoring so you can see what actual visitors experience. When a metric slips, it alerts you, which turns Core Web Vitals from a quarterly audit into a daily safety net. Its own comparison pages put its price at $49 a month to start, and its blog calls it the tool to buy first for ongoing monitoring. It also covers experiment tracking, so you can test a fix and see whether the metric actually moved.
What we like- Combines scheduled lab tests, real-user monitoring, and CrUX trends
- Alerts you when a metric slips
- Tracks the exact metrics Google judges
- Clear reporting that a non-developer can read
Watch out for- Paid only, with no free tier beyond a 14-day trial
- Cost scales with pages monitored and test frequency
- The cheapest plan covers a limited number of pages
#5
SpeedCurve
Best for: Performance teams that want synthetic tests plus real-user data tied to business numbers
Visit speedcurve.com
Starting priceFrom $15 per month (reported)
Free planNo free plan
SpeedCurve pairs synthetic monitoring with its own real-user monitoring product, LUX, and it is built for performance teams who want to line speed up against business numbers and competitors. It supports Lighthouse scores, so you get performance, accessibility, and best-practice assessments alongside Core Web Vitals, and it tracks competitors so you can see whether you are faster or slower than the sites you compete with. Pricing is reported from $15 a month for synthetic monitoring and $83 a month for real-user monitoring, scaled by sites and pageviews. The gap is CrUX: SpeedCurve does not report Google's field data, so pair it with PageSpeed Insights for the official verdict.
What we like- Pairs synthetic tests with its own real-user monitoring product, LUX
- Built to line speed up against business metrics and competitors
- Supports Lighthouse scores and performance budgets
- Strong for teams, not just solo users
Watch out for- Paid only, with no free tier
- Pricing scales by sites, synthetic tests, and real-user pageviews
- Does not include Google CrUX data in its reporting
- Built for teams, so it is more than a small blog needs
#6Calibre
Best for: Teams that want RUM, CrUX, and synthetic tests in one monitoring platform4.4/5 on
G2 (8 reviews, checked Oct 2026)
Visit calibreapp.com
Starting priceFrom $75 per month
Free planNo free plan
Calibre is an all-in-one web performance monitoring platform for teams, and its pricing page is refreshingly public. The Starter plan costs $75 a month and includes 5,000 real-user sessions, 5,000 synthetic tests, and Google CrUX Core Web Vitals data. The Team plan at $150 a month doubles the allowances, and the Company plan at $1,500 a month is built for large operations. Having RUM, CrUX, and synthetic tests in one dashboard means you can see a lab regression, check whether real users felt it, and confirm it against Google's field data without switching tools.
What we like- Tracks real-user sessions, Google CrUX data, and scheduled synthetic tests together
- Pricing page is public and clear
- Test packs let you expand capacity without changing plans
- Strong for agencies managing several sites
Watch out for- The $75 entry price is high for a single small site
- No free tier, so you pay before you can test it
- The Company plan at $1,500 a month is a big jump for large teams
#7
Dareboost
Best for: Multi-page monitoring with actionable fix suggestions
Visit dareboost.com
Starting priceFrom $22 per month (reported)
Free planFree trial
Dareboost is a website performance monitoring and analysis tool that covers more than speed scores. It monitors pages on a schedule, tests user journeys such as checkout funnels, and gives actionable recommendations for each issue it finds, which suits teams that need to know what to fix, not just what is slow. Its pricing starts from a reported $22 a month billed yearly for a configurable plan with one monitored page and 50 analysis reports a month, while the Performance plan adds 15 monitored pages with tests every 30 minutes. It runs tests from 13 locations, including Paris, London, Frankfurt, and Washington DC.
What we like- Monitors many pages with actionable recommendations, not just scores
- Covers speed, user journeys, and front-end quality
- 13 test locations across continents
- Free trial to test it before paying
Watch out for- The $22 figure is third-party reported and billed yearly
- The interface is denser than GTmetrix or PageSpeed Insights
- The full feature set sits on higher plans that cost far more
#8
Treo
Best for: Lighthouse-based monitoring with a visual timeline of page loads
Visit treo.sh
Starting priceFrom $79 per month (reported)
Free planFree trial
Treo harnesses Lighthouse to emphasize user experience metrics, with a visual representation of your site's performance that shows how the load unfolds over time. You can modify CPU capacity and network speed to replicate the conditions your audience actually faces, which matters when your visitors are on old phones or slow connections. It offers an API for automation, and a free trial lets you test it before paying. Third-party listings put its price at $79 a month to start. It is the least well documented tool on this list, so run the trial on your own key pages before committing.
What we like- Visual timeline shows how the page experience unfolds over time
- Lets you adjust CPU and network speed to match your audience
- API access for automation
- Free trial available
Watch out for- The $79 starting price is high for a small site
- Third-party reported rather than confirmed on the vendor page
- Smaller vendor with less documentation than the bigger names
How we picked
We picked tools that measure Core Web Vitals directly, either through Lighthouse lab tests, CrUX field data, or real-user monitoring, and that are actively sold in 2026. We checked each vendor pricing page through search results on 12 November 2026, and we flagged every price as reported where we did not open the vendor page directly. This is desk research from vendor pages, documentation, and public reviews, not hands-on testing.
Frequently asked questions
What are the three Core Web Vitals?
The three Core Web Vitals are Largest Contentful Paint, which measures how fast the main content loads and should be under 2.5 seconds; Interaction to Next Paint, which measures how quickly a page responds to a tap or click and should be under 200 milliseconds; and Cumulative Layout Shift, which measures how much the page jumps while loading and should be under 0.1. Google replaced First Input Delay with Interaction to Next Paint in March 2024.
Is PageSpeed Insights enough to check Core Web Vitals?
For one-off checks, yes, because it shows the CrUX field data Google uses to judge your site, plus Lighthouse lab scores for diagnosis. It is not enough for ongoing monitoring, since it checks one URL at a time, keeps no history, and sends no alerts.
Why does my site pass in the lab but fail in the field?
Lab tests run on a fast connection and a powerful device, while field data comes from real visitors on slow connections, old phones, and busy networks. Third-party scripts, ads, and large images hurt real visitors far more than they hurt a lab test. The fix is to test with realistic conditions, check the CrUX field data for your actual pages, and prioritize the issues that affect the slowest visitors, not the average ones.
How do I fix a bad Largest Contentful Paint score?
Start with the largest element on the page, which is usually a hero image or a headline block. Compress and resize the image, preload it, and remove render-blocking scripts and stylesheets that delay it. Server response time matters too, so check your hosting and caching. Test the fix in WebPageTest with a filmstrip, which shows whether the main content actually appears earlier after the change.
Do Core Web Vitals affect Google rankings?
Yes, but they are one signal among many, and strong content can still rank on a slow page. Google uses page experience as a ranking factor, and a page that fails Core Web Vitals competes at a disadvantage against a similar page that passes.
Sources we checked (11)
- https://pagespeed.web.dev/
- https://gtmetrix.com/
- https://webpagetest.org/
- https://debugbear.com/
- https://speedcurve.com/
- https://calibreapp.com/pricing
- https://dareboost.com/
- https://treo.sh/
- https://www.debugbear.com/software/best-website-performance-monitoring-tools
- https://www.debugbear.com/software/gtmetrix-alternatives
- https://www.theseodesk.com/blog/the-best-site-speed-testing-tools-in-2026
Is your product missing or out of date?
We review this list regularly. Vendors can request a listing, send updated pricing or ask about featured placement.

Shihab Mia · Founder, Rankite
Shihab has 5+ years in B2B and SaaS SEO. He writes Rankite's software buying guides from pricing pages, documentation and public user reviews. More about Shihab.