How we make this list: we compare pricing pages, product documentation and public user reviews. Ratings come from G2, Capterra or Trustpilot, with the date we checked them.
Key takeaways
- Netdata is a real-time, per-second monitoring tool, and its alternatives differ in deployment, pricing model, and scope.
- Grafana Cloud is the best dashboard pick, with full-stack observability, Adaptive Telemetry, and a Knowledge Graph in every stack.
- Prometheus is the best open-source pick, with time-series metrics, Kubernetes discovery, and a CNCF graduated project.
- Datadog is the best all-in-one SaaS pick, with infrastructure, logs, APM, security, and AI agents in one platform.
- Zabbix is the best enterprise open-source pick, with no license fees, no per-device charges, and a fully managed cloud option.
- Checkmk is the best hybrid IT pick, with automated discovery, dependency mapping, and SLA reports across servers, networks, and cloud.
- LibreNMS is the best network pick, with automatic discovery, SNMP support, bandwidth billing, and distributed polling.
- SigNoz is the best OpenTelemetry pick, with APM, logs, traces, and dashboards from 49 dollars per month with no host or user pricing.
- New Relic is the best AI observability pick, with intelligent observability, 800 plus integrations, and a free tier with no credit card.
Quick comparison
| Tool | Best for | Starting price | Free plan |
|---|
 Grafana Cloud | Dashboards | See website | Free tier |
 Prometheus | Open source | Free open source | Yes |
 Datadog | All-in-one SaaS | See website | Free tier |
 Zabbix | Enterprise open source | Free open source | Yes |
 Checkmk | Hybrid IT | See website | Free trial |
 LibreNMS | Network | Free open source | Yes |
 SigNoz | OpenTelemetry | $49 per month | Free trial |
 New Relic | AI observability | See website | Free tier |
Is your product missing or out of date?
We review this list regularly. Vendors can request a listing, send updated pricing or ask about featured placement.
The best Netdata alternatives
#1Grafana Cloud
Best for: Dashboards4.5/5 on
G2 (220 reviews, checked Oct 2026)
Visit grafana.com
Starting priceSee website
Free planFree tier
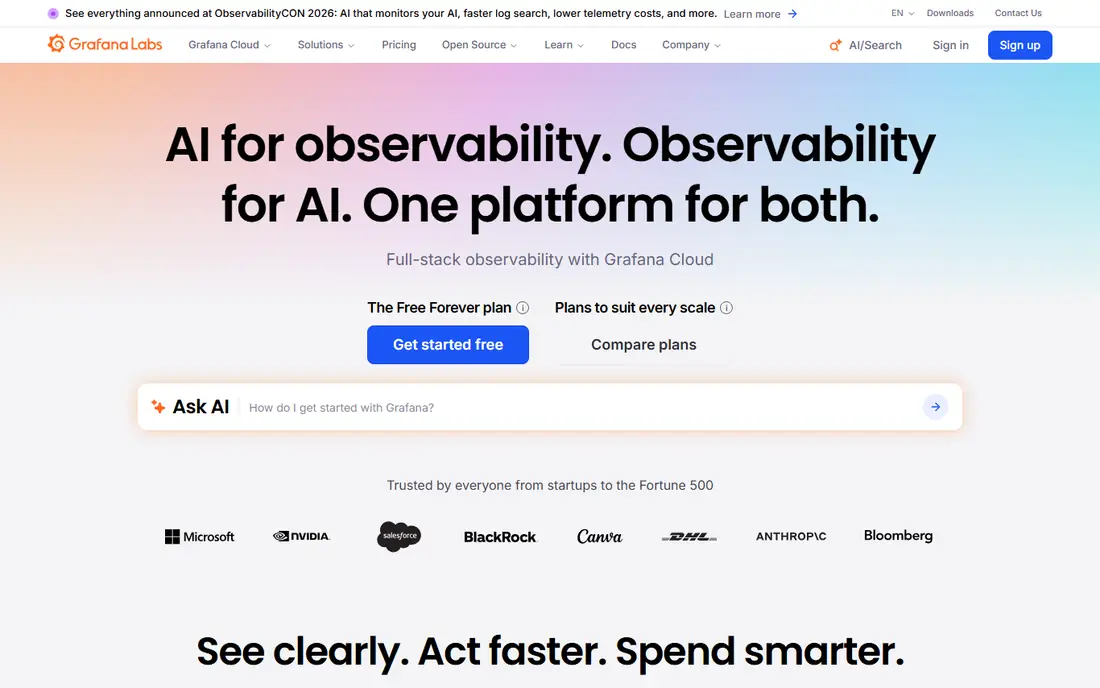
Grafana Cloud is the best dashboard pick. Its homepage describes full-stack observability for the agentic era, with AI for observability and observability for AI on one platform. Features include Adaptive Telemetry that automatically identifies the data worth attention and aggregates the rest, cutting telemetry costs 30 to 50 percent on average, a Knowledge Graph in every stack unifying telemetry signals into one clear map, and plug-in support for existing tools and data sources with no rip-and-replace required, built on open standards like OpenTelemetry and Prometheus with hundreds of plugins. Grafana Cloud includes incident response, testing, and synthetic monitoring, with certifications including FedRAMP, PCI DSS, SOC Type II, and GDPR compliance. Comparison sources cite a free tier with 10,000 metrics series, 50 GB logs, 50 GB traces, and 3 users, plus a platform fee from 19 dollars per month plus usage.
The trade-off is usage pricing. Grafana Cloud bills on data volume, so high-cardinality metrics can grow costs quickly. For teams that want the best dashboards with open standards, Grafana Cloud is the best pick.
What we like- Full-stack observability with incident response, testing, and synthetic monitoring
- Adaptive Telemetry cuts costs 30 to 50 percent on average
- Built on OpenTelemetry and Prometheus
Watch out for- Pricing by quote on the homepage
- Usage-based costs need monitoring
Starting priceFree open source
Free planYes
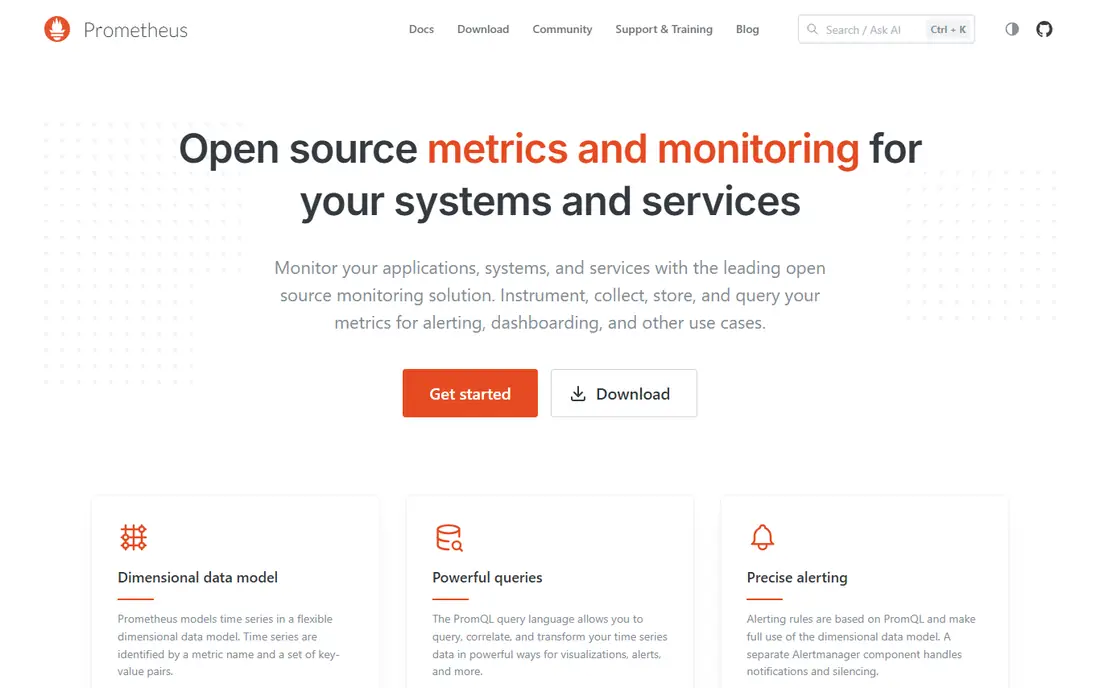
Prometheus is the best open-source pick. Its homepage describes open-source metrics and monitoring for systems and services, letting teams instrument, collect, store, and query metrics for alerting, dashboarding, and other uses. Features include design for the cloud native world with integration with Kubernetes and other cloud and container managers for continuous discovery and monitoring, plus a strong open-source community with all components under the Apache 2 License. Prometheus is the second project to graduate from the CNCF after Kubernetes, and its model of treating time-series data as a data source for generating alerts comes from Google's Borgmon tradition.
The catch is scope. Prometheus handles metrics only, so teams need Grafana for dashboards and additional tools for logs and traces. For teams that want full control over metrics collection, Prometheus is the best pick.
What we like- Leading open-source monitoring for systems and services
- Kubernetes discovery
- 100 percent open source under the Apache 2 License
- Second CNCF graduated project after Kubernetes
Watch out for- Metrics only, needs Grafana for dashboards and Loki or Tempo for logs and traces
- Self-managed scaling takes work
Starting priceSee website
Free planFree tier
Datadog is the best all-in-one SaaS pick. Its homepage describes cloud monitoring as a service, with an AI-powered monitoring and security platform for cloud applications providing full-stack observability across infrastructure, APM, logs, and more. Products include infrastructure monitoring from overview to deep details, log management for rapid troubleshooting, APM for app performance, Bits AI agents that chat, investigate, and remediate issues, security for unified security and observability, network monitoring across cloud environments, synthetic monitoring for critical application features, real user monitoring for user journeys and frontend performance, and serverless monitoring for a comprehensive view of serverless applications. Comparison sources cite a free infrastructure tier for up to 5 hosts with 1-day retention, Infrastructure Pro from 15 dollars per host per month billed annually, and APM from 31 dollars per host per month.
The trade-off is cost complexity. Datadog bills per host plus per GB and per event, so every metered dimension stacks. For teams that want one vendor for everything and can model costs carefully, Datadog is the best pick.
What we like- Full-stack observability across infrastructure, logs, APM, security, and network
- Bits AI agents that chat, investigate, and remediate
- Synthetic and real user monitoring
Watch out for- Pricing by quote on the homepage
- Metered dimensions stack up, so bills need careful modeling
#4Zabbix
Best for: Enterprise open source4.3/5 on
G2 (209 reviews, checked Oct 2026)
Visit zabbix.com
Starting priceFree open source
Free planYes
Zabbix is the best enterprise open-source pick. Its homepage describes an enterprise-class open-source observability solution, adaptable and enterprise-ready with exceptionally low total cost of ownership, predictable fixed support pricing, no license fees, and no per-device charges no matter the size of the environment. Features include a single pane of glass across IT and OT infrastructure, deployment options including free on-premise, fully managed Zabbix Cloud, and public cloud on AWS, Azure, and Google Cloud, plus 20 years of experience, a global partner network with 290 plus partners, and 24/7 support with an average response time of 12 minutes. Case studies include SEB Bank, the European Space Agency monitoring the Columbus lab aboard the ISS, and a self-service market company reducing perishable product losses by 75 percent.
The catch is effort. Zabbix rewards teams that invest in templates and configuration, while Netdata offers faster out-of-the-box value. For enterprises that want open-source monitoring with predictable costs, Zabbix is the best pick.
What we like- No license fees and no per-device charges
- On-premise, cloud, and public cloud deployment
- Trusted by Fortune 500 companies
- 24/7 support with 12-minute average response
Watch out for- Setup and tuning take more effort than Netdata's auto-discovery
- Interface feels dated to some teams
Starting priceSee website
Free planFree trial
Checkmk is the best hybrid IT pick. Its homepage describes full-stack monitoring and observability for hybrid IT, turning monitoring insights into actionable intelligence with out-of-the-box integrations for ServiceNow, Jira, and Slack, plus flexible APIs. Features include pre-built dashboards, advanced analytics, and SLA reports for real-time visibility, dependency mapping tracking business service health to underlying components, Explain with AI for one-click root cause summaries, a storage backend managing hundreds of global sites from a single location, built-in multi-tenancy for data segregation, and automated discovery across servers, networks, storage, cloud workloads, containers, and applications through one of the largest integration catalogs in the market. Checkmk rates 4.7 out of 5 from 114 reviews, and its new MCP server connects AI models to live site data.
The trade-off is packaging. Checkmk's free edition covers basics, while enterprise features like multi-tenancy and advanced analytics need paid editions. For hybrid IT estates that need one platform across on-premise and cloud, Checkmk is the best pick.
What we like- Single source of truth across infrastructure, applications, and end-user experience
- Automated discovery across servers, networks, storage, cloud, and containers
- Dependency mapping and SLA reports
Watch out for- Pricing by quote on the homepage
- Enterprise features need paid editions
Starting priceFree open source
Free planYes
LibreNMS is the best network pick. Its homepage describes a free and open-source network monitoring system with automatic discovery of the entire network using CDP, FDP, LLDP, OSPF, BGP, SNMP, and ARP. Features include highly flexible alerting via email, IRC, Slack, and more, a full API to manage, graph, and retrieve data, a billing system generating bandwidth bills for ports based on usage or transfer, automatic updates, distributed polling for horizontal scaling, native iPhone and Android apps, extensive device support, a mobile-friendly web UI, a Unix agent, and multiple authentication methods including MySQL, HTTP, LDAP, Radius, and Active Directory. LibreNMS offers an online demo and commercial support through partners.
The catch is scope. LibreNMS excels at network devices but covers servers and applications less deeply than Netdata or Zabbix. For network teams that need SNMP monitoring and bandwidth billing at zero license cost, LibreNMS is the best pick.
What we like- Automatic discovery via CDP, FDP, LLDP, OSPF, BGP, SNMP, and ARP
- Customizable alerting via email, IRC, Slack, and more
- Bandwidth billing and distributed polling
- Free and open source
Watch out for- Network-focused, weaker on server and application monitoring than Netdata
- Community support only
Starting price$49 per month
Free planFree trial
SigNoz is the best OpenTelemetry pick. Its homepage describes a one-stop platform for observability needs, moving from symptoms to evidence across APM, logs, traces, infra, LLM telemetry, alerts, and dashboards. Features include agent-native observability with an MCP server bringing telemetry into coding agents and Noz, an AI teammate inside SigNoz Cloud, fast troubleshooting without context switching using open standards instead of vendor SDKs, query builder, PromQL, and ClickHouse SQL on a fast columnar datastore for high-cardinality data, and pricing with no host-based or user-based charges, only usage-based telemetry volume. SigNoz Cloud Teams starts from 49 dollars per month, Enterprise from 4,000 dollars per month, and SigNoz powers 10,000 plus engineering teams.
The trade-off is maturity. SigNoz is newer than Datadog or New Relic, so its ecosystem is smaller, though its OpenTelemetry-native design avoids lock-in. For teams standardizing on OpenTelemetry, SigNoz is the best pick.
What we like- OpenTelemetry-native APM, logs, traces, infra, and LLM telemetry in one platform
- No host-based or user-based pricing
- Query builder, PromQL, and ClickHouse SQL
- SOC 2 Type II and HIPAA compliance
Watch out for- Newer vendor than Datadog or New Relic
- Self-hosting still needs operational effort
#8New Relic
Best for: AI observability4.4/5 on
G2 (586 reviews, checked Oct 2026)
Visit newrelic.com
Starting priceSee website
Free planFree tier
New Relic is the best AI observability pick. Its homepage describes observability built to understand AI, with intelligent observability resolving issues at scale before they impact the bottom line. Features include business-aligned observability connecting application performance to customer experience and revenue, digital experience monitoring with session replay and AI, AI and agentic monitoring for managing agents, scaling safely, and controlling costs, infrastructure monitoring for cloud-native and Kubernetes environments, logs with instant data search, security with unified vulnerability management, and 800 plus pre-built integrations. New Relic is trusted by Domino's, Shutterstock, Bangkok Bank, Atlassian, Verizon, and Toyota, and offers full platform access for free with no credit card required. Comparison sources cite a free tier with 100 GB per month and 1 full user, plus Standard from 10 dollars for the first user then 99 dollars per user.
The catch is pricing model. New Relic bills per user plus per GB over 100 GB, so data-heavy teams should model costs carefully. For teams that want AI observability with strong APM depth, New Relic is the best pick.
What we like- Intelligent observability that thinks, acts, knows, predicts, and protects
- AI and agentic monitoring for models and agents
- 800 plus pre-built integrations
- Full platform free with no credit card
Watch out for- Pricing by quote on the homepage
- Per-user and per-GB pricing needs careful modeling
How we chose
We compared tools that replace Netdata across its core jobs: real-time metrics, alerting, dashboards, and infrastructure visibility. Each vendor homepage was opened to confirm the product exists today and matches its category, and we kept a mix of dashboard platforms, open-source stacks, all-in-one SaaS, enterprise open-source, hybrid IT, network, OpenTelemetry-native, and AI observability tools, since Netdata users range from homelab operators to enterprise SRE teams. Pricing is taken from vendor homepages where published, and written as See website where vendors price by quote or on pricing pages not shown on the homepage.
Switching from Netdata without losing visibility
Your agents do not migrate automatically, so plan a staged rollout: install the new agent alongside Netdata on a pilot group, confirm metrics and alerts match, then roll out to the full estate before retiring Netdata. Budget time for re-creating dashboards and alert rules, which rarely transfer between vendors. Export historical data before cancelling, since retention policies differ.
Test with a small group first. Run the new tool alongside Netdata for one incident cycle, compare alert quality and dashboard usefulness, and fix gaps before migrating the whole team. Finally, check pricing models carefully: per-host, per-user, per-GB, and usage-based pricing can change total cost dramatically as your estate grows.
Frequently asked questions
What is the closest alternative to Netdata?
Grafana Cloud with Prometheus is the closest open-stack replacement, offering dashboards, alerting, and metrics at scale. For a single-vendor SaaS, Datadog is the closest all-in-one replacement.
Which Netdata alternative is cheapest?
Prometheus, Zabbix, and LibreNMS are free open source, so infrastructure is the only cost. For managed services, SigNoz Cloud from 49 dollars per month and Grafana Cloud's free tier are the lowest entry points.
Can I self-host these tools?
Yes. Prometheus, Zabbix, LibreNMS, and SigNoz all offer self-hosting, while Grafana, Datadog, and New Relic are primarily cloud services with some on-premise options. Checkmk offers both on-premise and cloud deployment.
Which alternative is best for network monitoring?
LibreNMS is the best network pick, with SNMP discovery, bandwidth billing, and distributed polling. Zabbix and Checkmk also cover network devices well for enterprise estates.
Which alternative is best for Kubernetes?
Prometheus with Grafana is the standard Kubernetes monitoring stack, with native service discovery. Datadog, New Relic, and SigNoz also offer strong Kubernetes support.
Do these tools support OpenTelemetry?
Yes, Grafana Cloud, SigNoz, Datadog, and New Relic all support OpenTelemetry, with SigNoz built natively on it. Prometheus supports OpenTelemetry metrics through receivers and exporters.
Sources we checked (8)
- https://grafana.com
- https://prometheus.io
- https://www.datadoghq.com
- https://www.zabbix.com
- https://checkmk.com
- https://librenms.org
- https://signoz.io
- https://newrelic.com
Is your product missing or out of date?
We review this list regularly. Vendors can request a listing, send updated pricing or ask about featured placement.

Shihab Mia · Founder, Rankite
Shihab has 5+ years in B2B and SaaS SEO. He writes Rankite's software buying guides from pricing pages, documentation and public user reviews. More about Shihab.