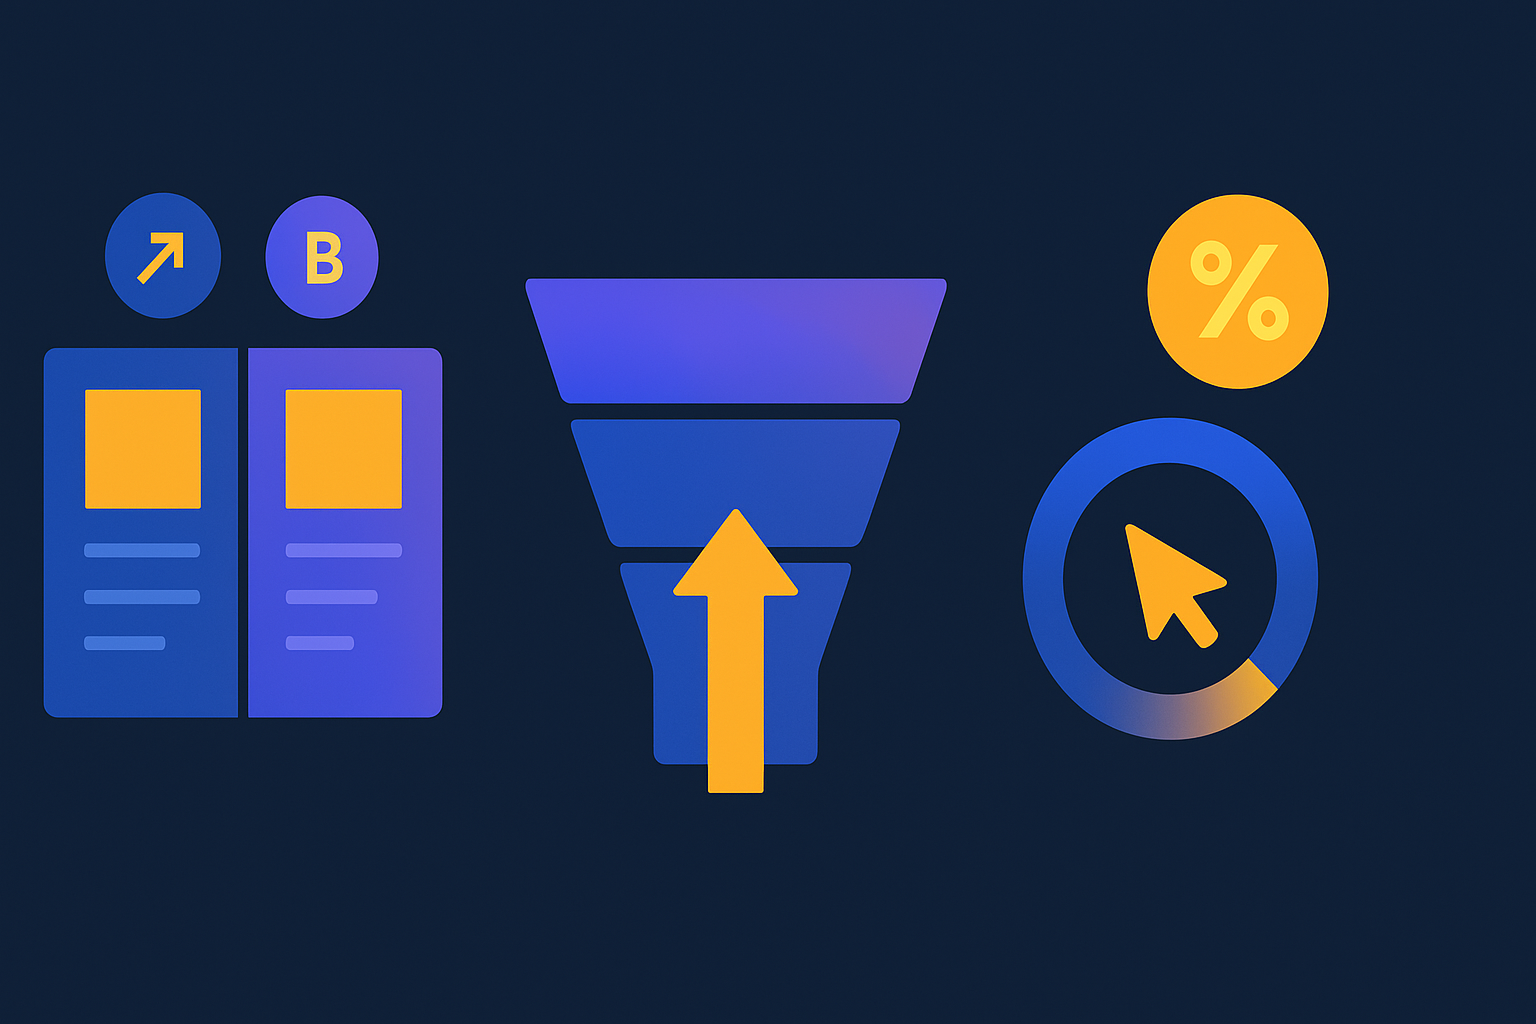
Conversion rate optimization best practices are the proven habits that turn more of your existing visitors into buyers, leads, or signups, and the single biggest lever is this: test your changes against real user behavior, not against opinion. If you sell to other businesses, the playbook shifts, so see B2B conversion rate optimization. Every practice below sits under that rule. The teams that win at CRO are not the ones with the best taste in button colors. They are the ones who watch what real people do, form a specific hypothesis, and let a properly run test decide, then repeat that loop until the gains compound.
This guide covers what CRO is and how to calculate conversion rate, the best practices ranked by impact, how to run a valid A/B test, what a good conversion rate actually is by industry, the mistakes that quietly waste your traffic, and the tools you need. If you want the search side of the same growth engine, our SEO for lead generation guide pairs naturally with this.
Conversion rate optimization, or CRO, is the practice of increasing the percentage of visitors who take a desired action, such as buying, signing up, or requesting a demo. It works by studying how real users behave on a page, forming a hypothesis about what blocks them, and testing changes against the current version to see which converts better. The core idea is to decide with evidence, not opinion.
The word "conversion" just means the action you care about. On an ecommerce product page it is a purchase. On a SaaS site it is a free trial. On a services site it is a filled-out contact form or a booked call. CRO does not care which one you pick, as long as you pick one clear goal per page and measure it honestly.
Divide the number of conversions by the total number of visitors in the same period, then multiply by 100. If 500 people visit a landing page and 15 fill out the form, the conversion rate is 15 divided by 500, times 100, which is 3%. Always define one specific action as the conversion and count unique visitors, not raw sessions, so the number stays honest.
That formula is the whole scoreboard. Everything else in this guide is about moving that number up without buying more traffic, which is why CRO is often the cheapest growth channel a business has: you are getting more out of visitors you already paid to acquire.
Here are the ten practices that move the needle most, roughly in the order you should tackle them. You do not do all ten at once. You find which one is your biggest leak, fix it, test it, then move to the next.
Before you change anything, look at what real users do. Analytics tells you where people drop off. Heatmaps and session recordings tell you why. Microsoft Clarity gives you both for free, and tools like Hotjar do the same. The point is to replace "I think the headline is weak" with "62% of visitors never scroll past the fold," which is a hypothesis you can actually test. Skipping this step is the reason most redesigns fail: they fix problems the site never had.
A visitor decides within seconds whether your page is worth their attention. Your headline should state what you offer, who it is for, and why it beats the alternative, in plain words. If someone cannot tell what you do from the top of the page without scrolling, no button tweak will save the conversion. Clarity of the offer usually beats cleverness of the copy.
Every field you ask for costs you conversions. The Baymard Institute found that the average checkout has 11.3 form fields when most sites need closer to 6 to 8, and unnecessary fields are a documented cause of abandonment. Cut every field you do not truly need, use progressive profiling to collect the rest over time, and never ask for a phone number when an email will do. On lead forms, fewer fields almost always means more leads.
The CTA is the moment of decision, so it should be impossible to miss and specific about what happens next. Use action-and-value copy like "Get my free audit" instead of a vague "Submit." Give the primary button enough contrast and whitespace that it is the obvious next step. One primary action per page beats three competing ones, because a confused visitor does nothing.
People look to others before they act. Reviews, ratings, real customer logos, testimonials with names, and specific results all lower the risk a visitor feels. Shopify notes, citing BrightLocal, that almost half of consumers trust customer reviews as much as a recommendation from a friend. The rule is that the proof must be real. Invented testimonials destroy trust the instant they are caught, so use only what actually happened.
Speed is a conversion lever, not just an SEO metric. Portent's site speed study found conversion rates drop by an average of 4.42% for every additional second of load time across the first five seconds, and the highest ecommerce conversion rates occur on pages that load in zero to two seconds. Keep your Core Web Vitals in the green: Largest Contentful Paint under 2.5 seconds, Interaction to Next Paint under 200 milliseconds, and Cumulative Layout Shift under 0.1. If your scores are not there yet, our Core Web Vitals optimization guide walks through fixing each metric individually.
Most of your traffic is on a phone. Statista reports mobile devices generate roughly 60% of global web traffic, and mobile commerce keeps taking a bigger share of ecommerce sales each year. That means thumb-friendly buttons, forms that work with a mobile keyboard, no pinch-to-zoom text, and a checkout that does not fall apart on a small screen. Test the mobile version first, then adapt up to desktop, not the other way around. Google's own research found that 53% of mobile site visits are abandoned if a page takes longer than three seconds to load, which is why mobile speed and mobile CRO have to be treated as one project, not two, going into 2026.
Every extra link, popup, or competing offer pulls attention away from the goal. Dedicated landing pages convert better than general pages partly because they strip out the navigation and give the visitor one path. On a page built to convert, cut anything that is not helping the visitor say yes. When lead capture is the goal, our guide to building a lead generation landing page walks through the exact structure that turns visits into form fills.
Showing returning visitors, different traffic sources, or different locations a more relevant version of the page can lift conversions, because relevance reduces friction. You do not need a heavy platform to start. Matching the landing page headline to the ad someone clicked is a simple, high-return form of personalization that most teams skip.
A change that "feels better" is a guess until a test proves it. A/B testing compares your current version against a variation with real traffic and tells you which actually converts better. It is the practice that makes every other practice on this list safe, because it stops you from shipping changes that quietly hurt. The next section covers how to run one that you can actually trust.
Doing this work well is exactly what our SEO content optimization service handles for clients, and it is closely tied to content optimization on the organic side, since the page that ranks and the page that converts are the same page.
Run a valid A/B test by deciding the sample size before you launch, changing one thing at a time, and letting the test run to completion at a 95% significance level with adequate statistical power. The most common way teams ruin a test is peeking: checking it constantly and stopping the moment it looks like a winner. CXL and Convert.com both warn that this inflates the false positive rate well past 30%, so you end up shipping changes that never really worked.
Here is the sequence that keeps a test honest:
There is no single good number, because a good conversion rate depends on your page type, industry, and traffic source. Unbounce's Conversion Benchmark Report puts the median landing page conversion rate near 6.6%, while broader WordStream data that includes all page types shows ecommerce purchases averaging closer to 2.35%. The useful target is not a universal figure. It is beating your own past performance and reaching the top quartile for your specific industry.
Here is a benchmark table to see roughly where you stand. Match the row to your actual page type, since comparing a checkout to an events landing page is meaningless.
| Page type or industry | Typical conversion rate | Source |
|---|---|---|
| Landing pages, all industries (median) | ~6.6% | Unbounce Conversion Benchmark Report |
| Events and entertainment | ~12.3% | Unbounce |
| Financial services | ~8.4% | Unbounce |
| SaaS | ~3.8% | Unbounce |
| Ecommerce (purchase) | ~2.35% | WordStream |
| B2B professional services | ~1 to 3% | FirstPageSage, 2025 |
| Top 10% of landing pages | 11.45% or higher | WordStream |
Treat these as a compass, not a scoreboard. A 3% rate can be excellent in a competitive B2B niche and poor for a well-targeted PPC landing page. Your baseline plus steady month-over-month improvement matters more than any benchmark. For a deeper breakdown by traffic source and industry, see our guide to landing page conversion rate benchmarks.
CRO fails in predictable ways. Watch for these:
You need three kinds of tools: analytics to see what happens, behavior tools to see why, and a testing tool to prove what works. You can run a real program at zero software cost by combining free options.
| Job | What it does | Common tools |
|---|---|---|
| Analytics | Shows where visitors come from and where they drop off | Google Analytics 4, Google Search Console |
| Behavior insight | Heatmaps and session recordings that show why people leave | Microsoft Clarity (free), Hotjar |
| A/B testing | Serves variations and measures which converts better | VWO, Optimizely, Convert, AB Tasty |
| Sample size and significance | Tells you how much traffic a test needs and whether a result is real | Any A/B test sample size and significance calculator |
The honest starter stack is Google Analytics 4 plus Microsoft Clarity plus a sample size calculator. That combination costs nothing and is enough to find your biggest leak, understand it, and test a fix. Paid testing platforms speed things up once you have the volume to justify them. If GA4 is not tracking your conversions correctly yet, fix that first with our GA4 conversion tracking setup guide, since a CRO program built on bad data will optimize for the wrong thing.
Each best practice only counts if you can measure whether it worked. This table maps each practice to why it works and the exact metric that tells you it landed, so no change ships on faith.
| Best practice | Why it works | How to measure it |
|---|---|---|
| Start from data | Fixes real friction, not imagined problems | Drop-off rate at each funnel step |
| Clear value proposition | Visitors decide in seconds whether to stay | Bounce rate and scroll depth on the fold |
| Reduce form friction | Every field costs completions | Form start rate vs completion rate |
| Sharpen the CTA | Removes hesitation at the decision point | Click-through rate on the primary button |
| Add social proof | Lowers perceived risk of acting | Conversion rate with vs without proof block |
| Improve page speed | Slow pages lose visitors before they act | Core Web Vitals plus conversion by load time |
| Design mobile-first | Most traffic is on a phone | Mobile vs desktop conversion rate gap |
| Remove distractions | One path beats many competing ones | Conversion rate on focused vs cluttered page |
| Personalize | Relevance reduces friction | Conversion rate by segment or source |
| A/B test properly | Proves the change before you trust it | Statistical significance and measured lift |
This is the same discipline we bring to client work. When we tightened the pages and calls to action for Meta Clipping Path, their lead flow rose 250%, because the wins came from the pages they already had rather than from more traffic.
What is conversion rate optimization? Conversion rate optimization, or CRO, is the practice of increasing the percentage of visitors who take a desired action, such as buying, signing up, or requesting a demo. It works by studying how real users behave on a page, forming a hypothesis about what blocks them, and testing changes against the current version to see which converts better. The core idea is to decide with evidence, not opinion.
How do you calculate conversion rate? Divide the number of conversions by the total number of visitors in the same period, then multiply by 100. If 500 people visit a landing page and 15 fill out the form, the conversion rate is 15 divided by 500, times 100, which is 3%. Always define one specific action as the conversion and count unique visitors so the number stays honest.
What is a good conversion rate? There is no single good number because it depends on your page type, industry, and traffic source. Unbounce's Conversion Benchmark Report puts the median landing page conversion rate around 6.6%, while WordStream data shows ecommerce purchases average closer to 2.35%. A useful target is to beat your own past performance and to reach the top 25% for your industry rather than chase a universal figure.
What are the most important CRO best practices? The highest-impact practices are starting from real user data instead of opinion, making the value proposition instantly clear, cutting form friction, sharpening calls to action, adding genuine social proof, improving page speed and Core Web Vitals, designing mobile-first, removing distractions, and validating every change with a properly run A/B test. Do these in order of impact for your specific page, not all at once.
How much traffic do I need to run an A/B test? Enough to reach statistical significance for the size of improvement you expect. As a rough working guideline many CRO teams treat around 30,000 visitors and at least a few thousand conversions per variation as a safe zone, though the real number depends on your baseline conversion rate and the lift you want to detect. Use an A/B test sample size calculator before you launch and commit to that number.
Why is my A/B test result not trustworthy? The most common reason is peeking: checking the test repeatedly and stopping the moment it looks like a winner. CXL and Convert.com both note that this inflates the false positive rate well past 30%, so you declare fake wins. Fix it by calculating sample size in advance, running the test to completion regardless of interim swings, and only trusting results at 95% significance with adequate statistical power.
Does page speed really affect conversions? Yes, measurably. Portent's site speed study found that conversion rates drop by an average of 4.42% with each additional second of load time across the first five seconds, and the highest ecommerce conversion rates occur on pages that load in zero to two seconds. Speed is a CRO lever, not just a technical SEO metric, so keep Core Web Vitals in the green.
Is CRO only for ecommerce? No. Any page with a measurable goal benefits from CRO, including SaaS free-trial signups, B2B demo requests, lead-generation forms, newsletter opt-ins, and app installs. The action changes but the method is identical: study behavior, form a hypothesis, test it, and keep what wins. Lead-generation pages often see the fastest gains because they usually start with more friction than a checkout.
What tools do I need to start CRO? You need three categories: analytics to see what happens (Google Analytics 4 and Search Console), behavior tools to see why (heatmaps and session recordings from tools like Microsoft Clarity, which is free, or Hotjar), and a testing tool to prove changes (VWO, Optimizely, Convert, or a built-in tester). Clarity plus GA4 is enough to run a real program at zero software cost.
How long does it take to see CRO results? A single A/B test usually needs one to four weeks to gather enough traffic for a valid result, and you want at least one full business cycle so weekday and weekend behavior are both included. Real compounding gains come from running many tests over months. Treat CRO as an ongoing program, not a one-time fix, because the biggest returns come from the cumulative wins.
Pick your single most important page, open Google Analytics 4 and Microsoft Clarity, and find the one step where the most people drop off. That leak is your first hypothesis. Fix it, run a proper A/B test to 95% significance, and let the result decide the next move. If you want an expert read on where your biggest conversion and search wins are hiding, build a content optimization strategy around these pages first, then book a free SEO audit call with Rankite and we will show you which pages to fix first.
Get a free, no-obligation SEO audit and a 30-minute strategy session. We'll show you exactly where the growth is hiding.
Fill out the form and we'll get back to you within one business day. Prefer email? Write to us directly at contact@rankite.com.